
The digital currency remains confined.
The price of bitcoin on Coinbase remains stuck between the recent lows from the in the September into October (between $7701 and $7762) and the 200 day moving average (green line in the chart below) at $8571.08 currently. The price has closed below its 200 day moving average for 12 straight days (this is day 13). That keeps the bias tilted to the downside on the daily chart.

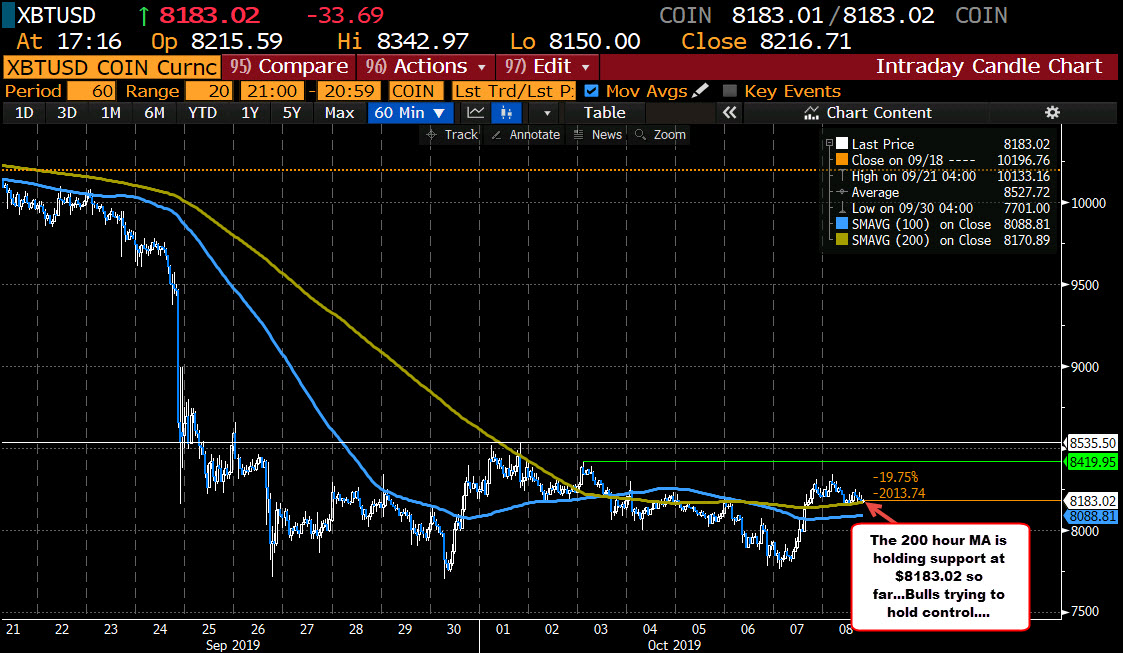
Drilling down to the hourly chart, the price moved back above the 100 and 200 hour MAs yesterday and is trying to hold support at the 200 hour MA now (green line). If the price can stall here (and/or above the 100 hour MA at $8088.81 - blue line). The price can move higher.
So there is a battle with defined levels to eye.
On the downside, the 200 hour MA at $8183.02 and 100 hour MA at $8088.81 are support. Stay above keeps the buyers in play.
On the topside, the 200 day MA at $8571.08 is the key upside level to eye. If the price does move higher, that level will be the next key barometer for both the buyers AND the sellers.

