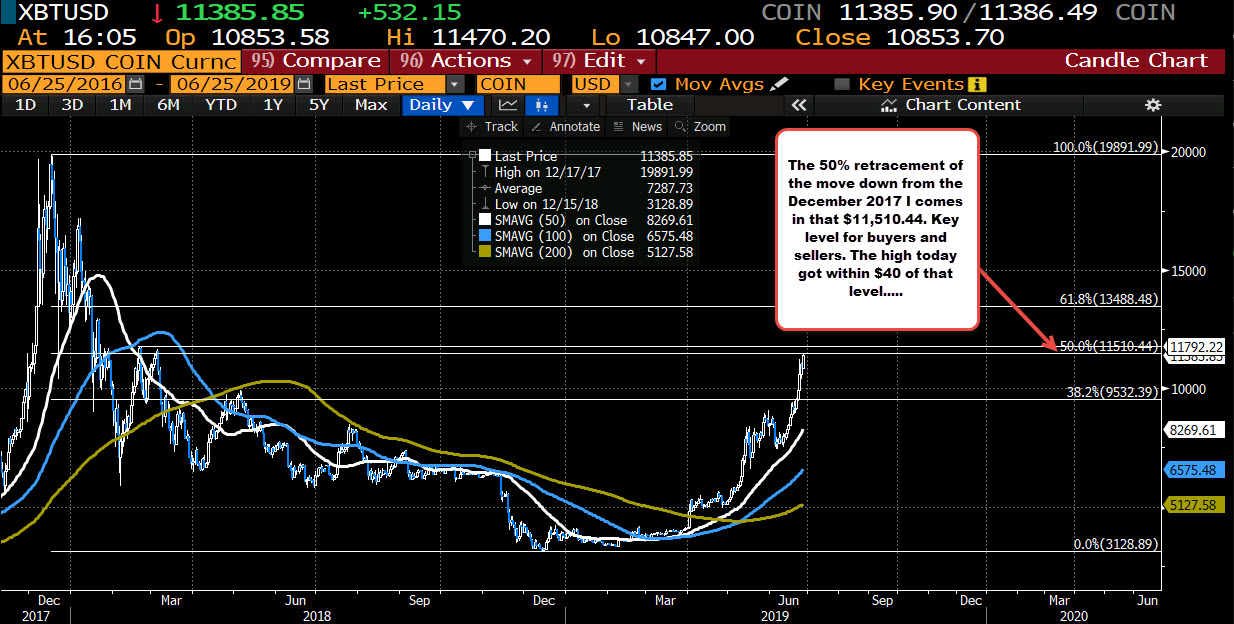
50% of the move down from the December 2017 high
The price of Bitcoin on Coinbase is up about $532 at $11385. The high today reached $11470.20. That got the price within $40 of the 50% midpoint of the move down from the December 2017 high at !9891.99, and the December 2019 low at $3128.89.
Over the weekend, I wrote in a post:
Another target comes from the daily chart. The 50% of the big move down from the December 2017 high comes in at $11510.44. Like the 50% on the hourly chart, it too will be key for the longer term picture of bulls and bears. It is a big line in the sand that buyers will need to break to keep the run higher. Be aware.
Being a key level, it works as a barometer for buyers and sellers.
For buyers, they want to see the level broken, and the trend higher continuing.
For sellers (may be new longs or profit takers), They want to see the price stall against the level and rotate back down. If it breaks above, those sellers can cover (and even go long).
So the level remains key. Today the digital currency had it's closest test but it was still $40 short of the target.
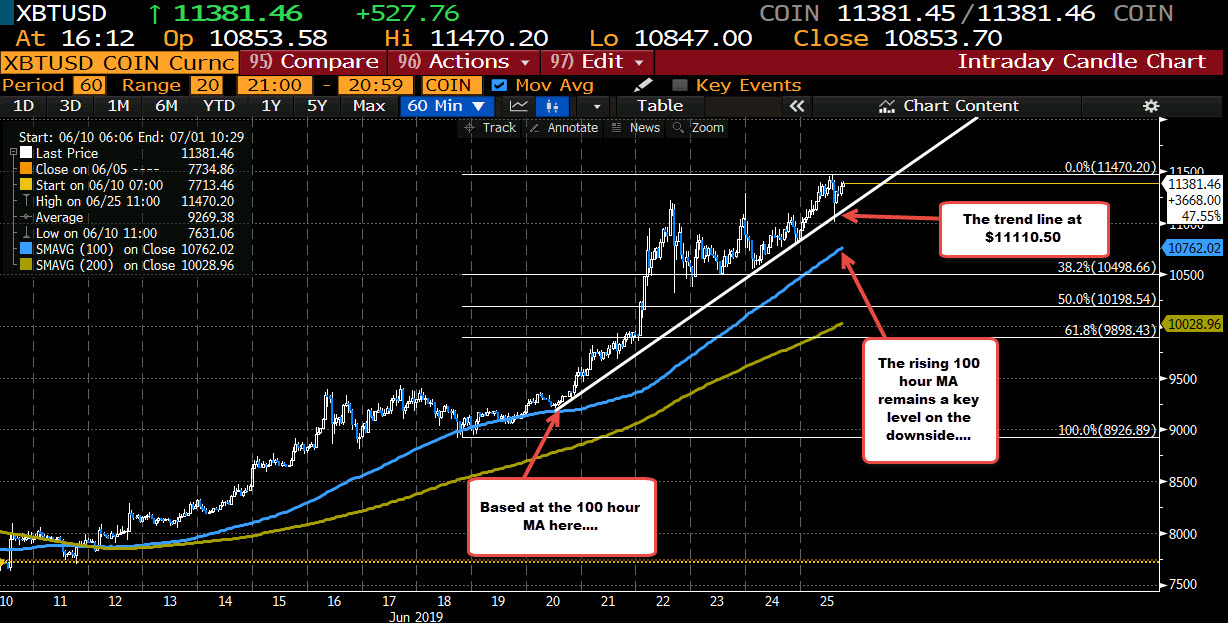
Drilling to the hourly chart below, a lower trend line comes in at $11,110.50 currently. A move belowt that level might see some selling with the lagging 100 hour MA (blue line) at $10762.02 (and moving higher) as another key level on the downside for sellers/bears. Stay above, and the sellers may win a battle but they are not winning the war.