
Ran higher after basing against the 100 and 200 hour MA
The price of Bitcoin moved above the 100 and 200 hour MAs on Monday and although the price did not race higher, the price did not move lower either. Today the pair tried to crack back lower, drifting below the 200 hour MA (green line) but stayed above the 100 hour MA (blue line).

That hold on the dip to support, gave the buyers the go ahead to take the price higher. The price is currently up $481 at $8612.40. The high reached $8712.45. That is just below the 38.2% retracement of the move down from the September 19 high at $8724.05. A break above the 38.2% retracement would open up the door for a further run toward the $9000 level.
Taking a broader look at the daily chart below, the move higher has now taken the price above its 200 day moving average at $8594.13. The price of bitcoin has closed below its 200 day moving average (green line on the chart below) for 13 consecutive days (the longest stretch since March/early April). The inability to run more to the downside and stay below the 200 day MA, is bullish for the digital currency.
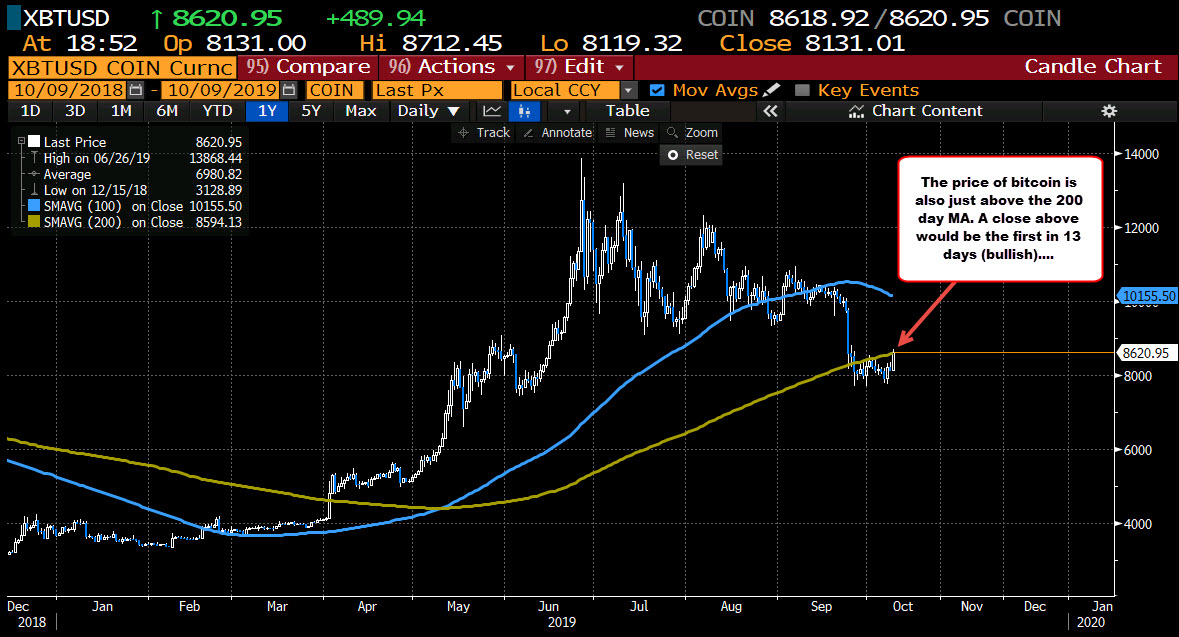
Buyers are making a play on the run back higher. The close above the 200 day moving average today (and staying above) would solidify the bias in the buyers direction with a run toward $9000 the next major target.

