
Good border line to lean against
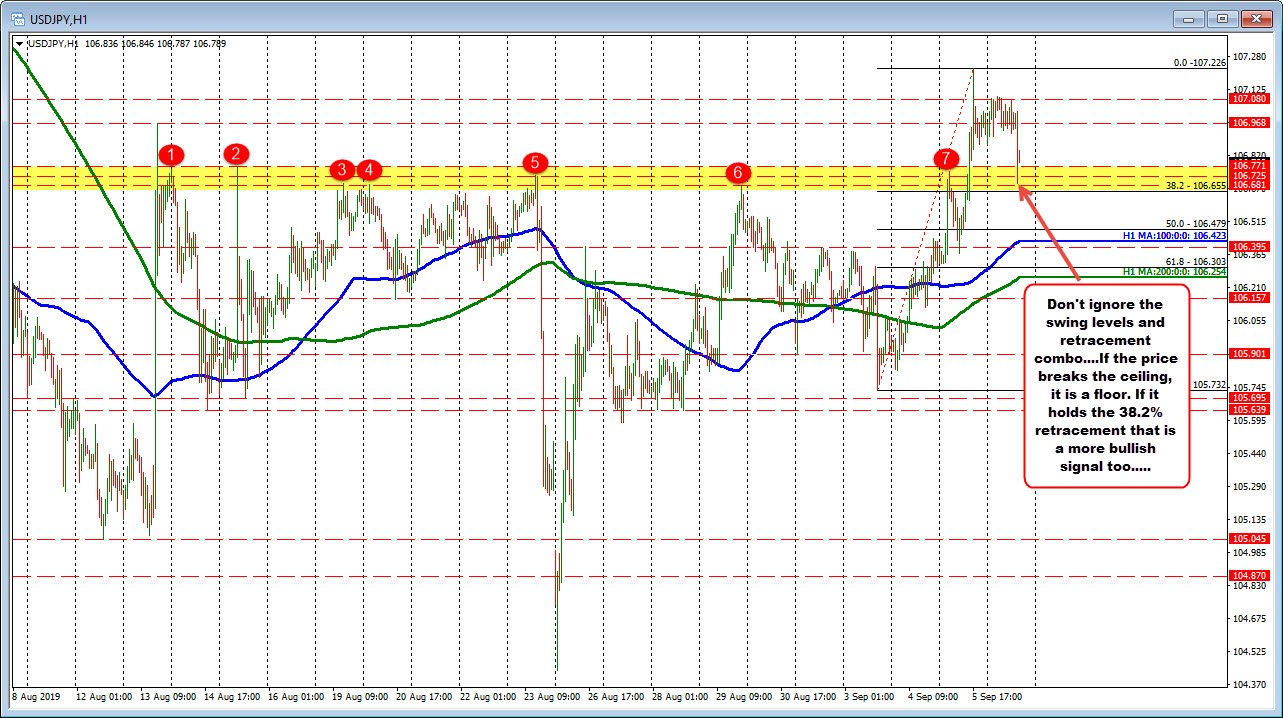
The USDJPY on the hourly chart has seen a lot of swing levels in the 106.68 to 106.77 area. I count 7 different swing highs going back to August 14 (see red numbered circles). Yesterday the price tested the level for the 7th time and backed off one final time before rebounding and finally breaking above.

What was resistance becomes support. That is basic technical analysis. That's a bullish break. Stay above is more bullish.
The price momentum moved the price to 107.226, and started to correct. If you put a Fibonacci retracement on the last trend move higher, the 38.2% retracement comes in at 106.655. That happens to be just below the low swing level in our chart (see yellow area).
With the combination of the old swing area and the modest 38.2% retracement near the same area, that helps to make the area "more important" on a correction lower.
Stay above and the bulls remain fully in control. The correction is just a modest one. The price remains above the old ceiling (now a floor).
Move below and things are not looking so great technically, as the prices would have moved back below the ceiling and also below its 38.2% retracement level. That should be enough to frustrate longs, turning buyers into sellers.
Today (so far), the price correction in the USDJPY has stalled in the yellow area and above the 38.2% retracement at 106.655. The low reached 106.691. The bulls remain in control. It may or may not stay that way, but the combo of the swing area and the 38.2% give a nice level to lean against where risk can be defined and risk limited.
So the lesson is look for ceilings (or floors) in combination with the 38.2% Fibonacci retracement. The area often gives a stronger clue for a low risk borderline for the buyers and the sellers to lean against.

