

Making use of the Fib
"Fibonacci" is a well-known word. It's the name of an Italian mathematician who became famous by discovering a peculiar series of numbers (0, 1, 1, 2, 3, 5, 8, 13, 21, 34, 55, 89, 144, etc).
Every number in this sequence is the sum of the two preceding ones. The ratios of these numbers mysteriously correspond to the proportions of things in the universe, from sunflowers to galaxies.
Long ago traders found that Fibonacci numbers and ratios can be suitable for technical analysis. Firstly, they are nicely mathematical and add a pleasing element of nerdiness. Secondly, they produce objective price reference points and thus reduce the subjectivity of analysis if used correctly.
Today, MetaTrader has a built-in set of Fibonacci tools. It includes retracement, expansion, fan, arcs, and time zones.
Fibonacci tools are used for 2 main purposes:
- To identify support and resistance levels (Fibonacci retracement).
- To predict the potential scope of price movement (Fibonacci expansion).
Let's focus on Fibo retracement levels and Fibo expansions as these tools offer the greatest merit to Forex traders.
Fibonacci retracement
The primary task of Fibo retracement tool is to determine the size of potential correction against the main trend.
It's very important to use this tool correctly. Here are the rules:
- Find a distinct high and a distinct low of the price.
- Apply the Fibonacci retracement levels from the left to the right connecting these two points of the price. For an uptrend, you'll draw this line from minimum to maximum. For the downtrend, you'll need to draw a line from maximum to minimum. Notice that there should not be higher highs or lower lows to the right of those that you chose.
- Include candlestick's shadows (wicks).
Then 9 horizontal lines will automatically appear intersecting the trend line at Fibonacci levels of 0%, 23.6%, 38.2%, 50%, 61.8%, 100%, 161.8%, 261.8%, and 423.6%. You can manually add 78.6% level. Where do these levels come from?
If you divide any consecutive numbers of the Fibonacci sequence, for example, 88 by 55, you will get 1.618 (the "golden ratio"). The level of 61.8% comes from 55/89 being equal to 0.618, while 38.2% is derived from skipping 1 sequence in division e.g. 55/144 = 0.382. The levels of 0%, 50%, and 100% are not Fibo numbers but they still represent important landmarks for the price.
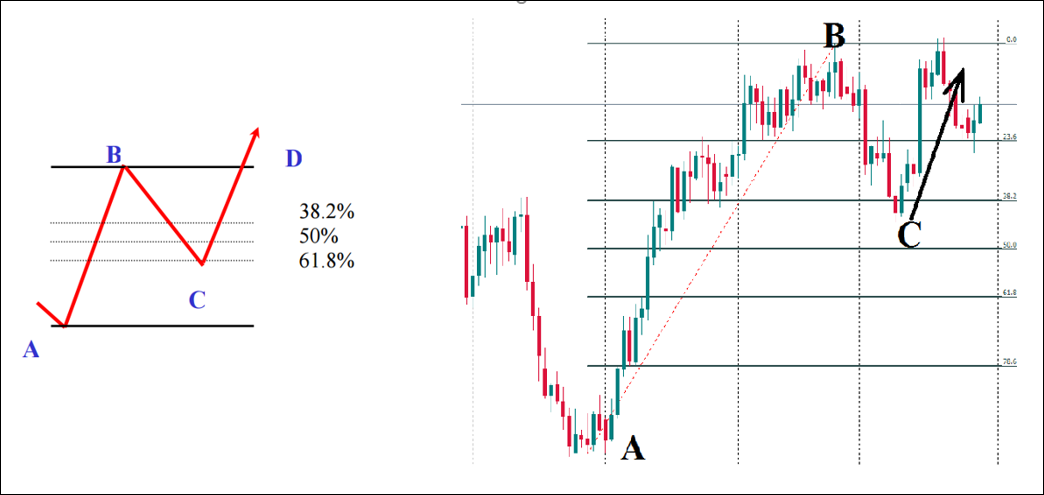
If you take Fibonacci from an uptrend, Fibo levels will provide support and limit the bearish correction. At the picture above, bearish correction ended at the point C (38.2% Fibo level). If you take Fibonacci from a downtrend, Fibo levels will provide resistance and limit the bullish correction.
When price arrives to the first Fibo level on its way, it's expected to pause. If the countertrend pressure is too big, it breaks the level and goes to the next one. Retracement levels of 38.2%, 50%, and 61.8% are considered the most important. If the price retraces more than 61.8% of the previous move (on a closing basis), the odds are that it will reach the beginning of a trend.
There are 2 main ways to trade using Fibo retracement tool:
- Aggressive traders can open positions at every Fibo level. If the price breaks one Fibo level, such traders target the next one. This is trading against the main trend.
- Conservative traders wait for the price to rebound from a Fibo level in the direction of the main trend. A confirmation signal at the point C is needed before such trader opens a position.
Important tips
1. Look at the area around a Fibonacci level rather than at an exact level. There's no pip-precision at the market.
2. Pay attention to the long-term trends. Fibo levels from longer-term trends and higher timeframes have more weight.
3. Use Fibonacci on several timeframes. When different Fibonacci levels converge, they become more significant.
4. Avoid using Fibos on very small timeframes. Experience shows that it works better from H1 and higher, though you can always experiment.
5. Don't count on Fibonacci alone. Fibonacci is not a ready-made solution for trading. To increase the probability of success, use other things together with Fibo retracement for confirmation.
What combos can be there? Fibonacci retracement plus a trend line may produce a good entry point. The 200-period Moving Average that is in the same area as 50% Fibonacci retracement will be a stronger obstacle for the price. You can take profit in this area or enter in the direction of the main trend. In addition, look for reversal candlestick patterns near the Fibo retracement levels.
Fibonacci expENsion
Fibonacci retracement can provide you not only with correction levels, but also with some targets. If the price retraces 100% of the previous trend and breaks 100% level, you can use 161.8% Fibo as the next target.

Fibonacci expANsion
Fibonacci expansion is a separate tool. If a trend resumes after a correction to the point C and goes beyond the point B, you can expect the market to move to the point D. Its location may be found by applying the 'Fibonacci expansion' tool to points A, B, and C (D is the projection of Fibo levels calculated on the basis of AB from the point C). The point D is a good place for a Take Profit order.

Conclusion
Fibonacci tools offer a way to mathematically break price action into sectors. It's a popular tool used by billions of market players. As a result, if you do Fibo based on a distinctive movement of the price, the odds are that many traders will do the same thing and cluster their orders around the Fibo levels. Thus the self-fulfilling prophecy will make these levels "work" for traders.
- This article was submitted by FBS

