
Some insights on the usage of the Ichimoku indicator
The Ichimoku indicator stands out among other
technical indicators. It's just another thing in technical analysis that came
from Japan. Its name is translated as "one glance". The idea is that it allows
traders to make a full-fledged judgment about the market after just several
seconds of gazing at the chart.
Learn more forex trading tips
In this article, we gathered the observations we made during the multiyear period of using this indicator.
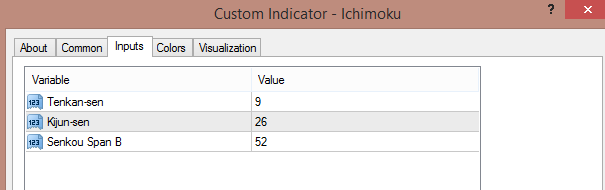
- The settings. When the indicator was developed (back in the 1930s), Japan had a 6-day workweek. The first parameter of the classical settings is 9 - a workweek and a half. The second parameter is 26 - the number of working days in a month and the third one is 52 - in 2 months. The classic settings (9-26-52) still suit weekly timeframe (there are 52 weeks in a year). For D1, the parameters which are adjusted for the 5-day workweek are 8-22-44. For H4, the recommended trio is 9-30-60. There may be also options like 12-24-120 for trending markets and the set 120-240-480 which allows to filter out flats on H1.

- The lines. There are 5 lines of Ichimoku that have tricky Japanese names (and English equivalents). The space between the two of them is colored and called the Cloud. Depending on its color we can tell who dominate the market - bears or bulls.

- Notice that all these lines are either Moving Averages or the price itself (Chinkou Span), and so they naturally have a high correlation with the price chart. The Cloud is shifted forwards, the two moving averages, Kijun and Tenkan aren't shifted anywhere, while Chinkou Span is shifted backward. Such representation reflects the idea of the past, the present, and the future. The lines with bigger periods - Kijun and Senkou Span B - show the medium-term trend. The lines with a smaller period - Tenkan and Senkou Span A indicate a short-term trend and are more often crossed by the price. Chinkou Span plays the role of Momentum oscillator (it allows to compare the current price with the price of some periods ago): when it diverges too much from the price chart, a correction usually follows. Lines 1-4 (see the chart below) act as support & resistance.
- The trend. The picture is bullish when the Cloud is bullish, the price is above the Cloud and expanding and Chinkou Span is above the price. Notice that it's necessary to look at the right part of the Cloud to estimate the current trend as the Cloud is shifted to the right.
- The signals. The key things to watch when you use the Ichimoku indicator are current price vs the Cloud; Tenkan vs Kijun (and vs the Cloud) and the color of the Cloud.

Here are all 5 Ichimoku lines. Currently, the indicator provides bearish signals: the bullish Cloud is narrowing; the red line went below the blue one (a "dead cross"); the green line crossed the price to the downside. Buyers still have a chance of resuming the long-term uptrend: the price is above the thick part of the Cloud that offers support.
- Strategies. There are many
strategies based on the Ichimoku indicator.
Trading the cross. One of the strongest bullish signals is a formation of a "Golden cross" above the Cloud (Tenkan goes above Kijun). The "Dead cross" (Tenkan goes below Kijun) below the Cloud is a strong bearish signal. However, such signals are rare. A bit weaker but also important are the crosses that happen inside the Cloud.
Trading the pullbacks. When the price is above the Cloud and Tenkan/Kijun but then retreats back to Kijun, it's possible to buy after the price rebounds from Kijun and advances above Tenkan.
Trading the breakout. When the price breaks the Cloud, traders open positions in the direction of the breakout.
It's also possible to use Ichimoku with other tools and indicators. For example, divergence in MACD and RSI will help to catch potential reversals and adjust exit from a trade.
Stop loss. There are different options with the boldest one to put a stop behind the opposite boundary of the Cloud. In many cases though, it would be wiser to go with your money management rules.
Exit. Ichimoku allows different approaches to closing positions - conservative (when Tenkan and Kijin cross in the direction opposite the trend) and more aggressive (when the price gets beyond Kijun/breaks the opposite border of the Cloud).
- Other considerations. When you are making a decision on H4, check D1 and H1 as well. If the signals are contradictory and confusing, better refrain from trading. In addition, the indicator was developed as the continuation of candlestick analysis. Don't open a trade if there are candlestick signals which go against the main signal.
Conclusion. Ichimoku indicator allows determining the trend and its strength with precision, as well as identity support and resistance levels. Even if your trading system consists of other things, it's good to apply Ichimoku to the chart and be able to see the picture in one glance.

