Brutal up and down price action
Looking at the USDCAD price action of late, I am reminded of what an old colleague of mine at Citibank used to say when markets were particularly choppy.
He would say "If you think about trading ____________, take two aspirin and lie down until the feeling goes away."
You can fill in the blank with the "USDCAD" of late. There has been lots of choppy action including today's run lower on the higher core CPI, and the snap back rally that erased the declines.
Nevertheless, in the ugliness, is there any broader technical themes in play when you see such price action. This is what I think:
- Realize that anything is possible. I am always looking for a break in an up and down market, but realize that there can also be failures
- On the chart, find technical areas that "seem" to be working. Put faith that they will give bias clues and levels to lean against to define risk,
- Be humble and don't fall in love with positions

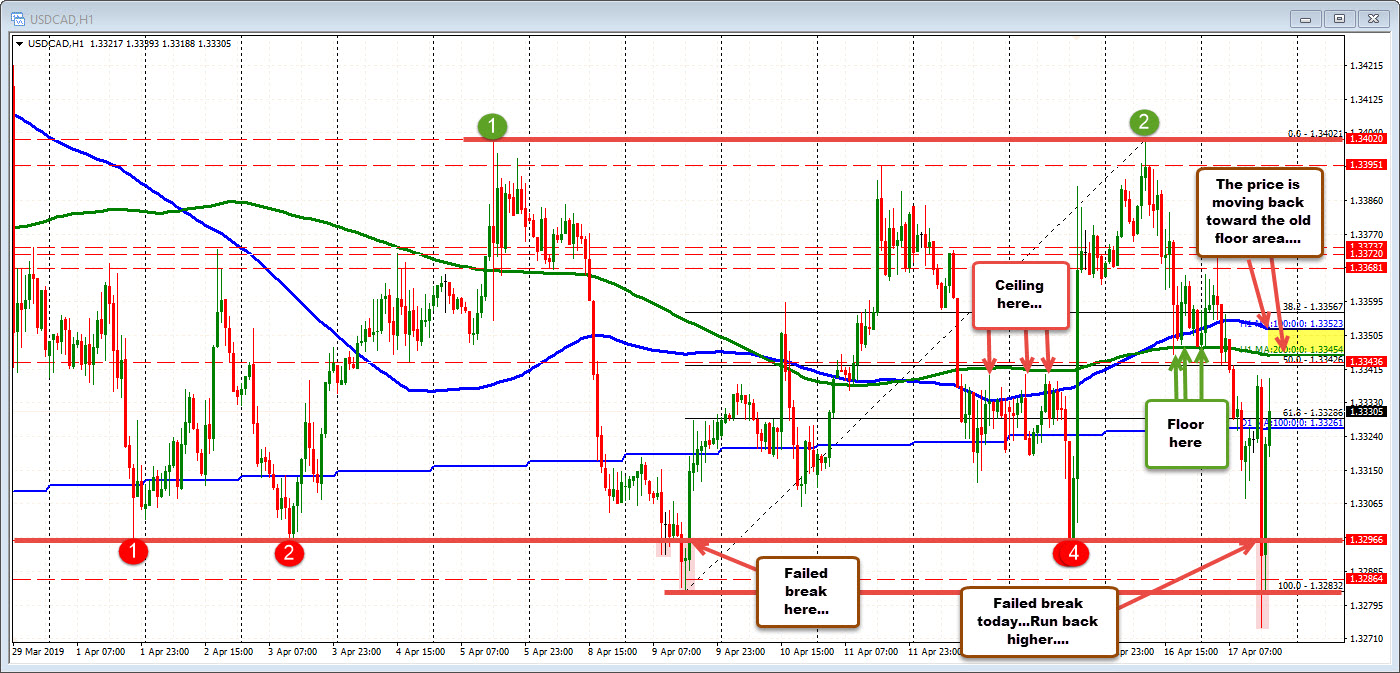
Looking at the hourly chart of the USDCAD, the 1.32966 area was home to 4 swing lows (see red circles). Yes there was a failed break on April 9 (anything can happen), but subsequently the price level was reestablished as a low on Monday (red circle 3 and 4). Key level.
The other thing is the 200 hour MA (green line in the middle of the chart) has done a good job of dissecting bullish and bearish bias in the middle of the up and down range.
Finally, there is a double top at the highs (see green circles 1 and 2). That was yesterday's "best trade".
So what happened today?
The price fell below the 200 hour MA earlier and stayed below (bearish). On the CPI data, the pirice tumbled lower and below the 1.32966. That is even more bearish. The price should have gone lower below the 1.32966 level. It did for a little while reaching 1.3273 on the break.
However, the price rebounded and then held the low from April 9 at 1.32832. Having the mindset that "anything can happen", a red flag goes up. You gotta be careful. You also have to be humble and realize you can't be in love with positions.
So sellers shifted - despite the bullish news - and turned to buyers. The race was on to the upside.
The price rise got close to the 200 hour MA (green line) at 1.33454 (high reached 1.3339). Sellers may be leaning and hoping the price stays below.
What now?
You always have the option to take two aspirin, lie down and wait for the trading feeling to go away.
Alternatively, you can lean against the 200/100 hour MAs and hope that the buyers off the low, are sellers against the MAs above.
The hope is the the price retests the 1.32966 level again, but remember, anything can happen and be humble. It will help you make sense of horrible up and down price action. If you are lucky and nimble from the homework, you may make a few bucks (but don't fall in love with the position).


