Why the focus is on the Treasury yield curve by Giles Coghlan

US 10 year Treasury yields touched a 14-month low in late March as concerns mounted regarding the trajectory of the Federal Reserve. This article is for you if you have been reading about the inverted yield curve in US Treasuries, but haven't really understood what it means. Don't worry if that is the case since one of the most often overlooked areas for FX traders is the impact the bond markets have on the FX sphere. However, it is an important area to master and not understanding why the inversion on bond yields is so important can be a major barrier in fundamental knowledge of the underlying financial forces at play in the equity, fx sphere and beyond. So, if you need a heads up on the inversion of the yield curve, and why it matters so much, read on. We will start with an explanation of what a bond actually is.
Firstly, understanding the basics of what a bond is
Think of a bond as simply a type of loan. It is a loan taken out by Governments and companies. When Governments and very large companies want to borrow money they can't easily go to a bank because of the huge amounts of money involved. So, a bond is the mechanism by which a Government or large corporation borrows money for their needs.The bond is issued for a set period of time. Bonds can be purchased for different lengths of time from short term, medium term and long term bonds. Short term bonds are only for a year or two, medium term bonds are up to 10 years and long term bonds are generally 10 years or longer. These bonds have a coupon or yield rate.
Secondly, understanding what a yield is on a bond
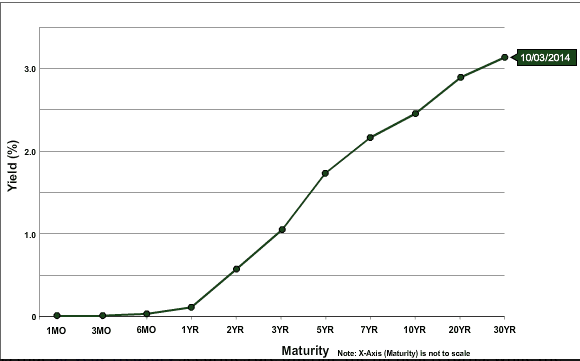
As an incentive to loan money to the Government or a large company the bond has a yield. The yield is an agreed interest payment on the value of the loan. So, for example, say you purchased a UK bond for £1000 with a yield of 5%, referred to as a coupon, you would receive £50 for each year you held the bond. Then, when the bond expires, you would receive back the original value you purchased the bond for. So, to be clear, the graph below shows a 'yield curve'. The black dots on the chart show the 'yields or coupons' for each bond. The 3YR bond is showing a yield just above 1%. The 7YR bond is showing a yield just above 2% and the 30YR bond has a yield of just over 3%. The dots are joined together and that creates what is known as the 'yield curve'.
Thirdly, understanding the yield curve
There are different types of 'yield curve' and they vary between 'steep curves, flat curves and, of course, the inverted yield curve'.
An example of a steep yield curve can be seen in the example above. The longer bonds offered a higher yield than the shorter bonds. This is as you would expect; the longer the loan, the higher the yield to compensate for your money being tied away for a longer period. You would expect a 30YR bond to compensate you more highly, as you don't have access to you original bond purchase for 30 years.
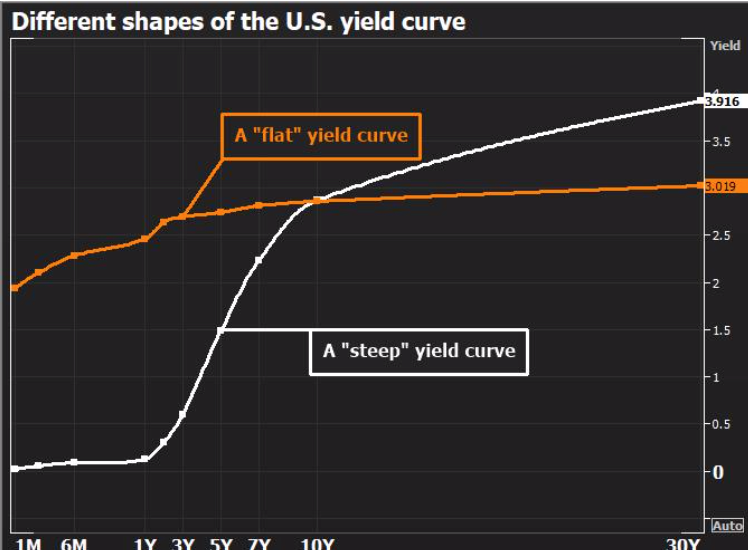
A flat yield curve, in contrast to a steep yield curve, can be seen in the chart below if you look at the orange line. In this example below the orange yield curve line is said to be 'flat' as a 10Y bond only yields marginally higher than a 3Y yield.
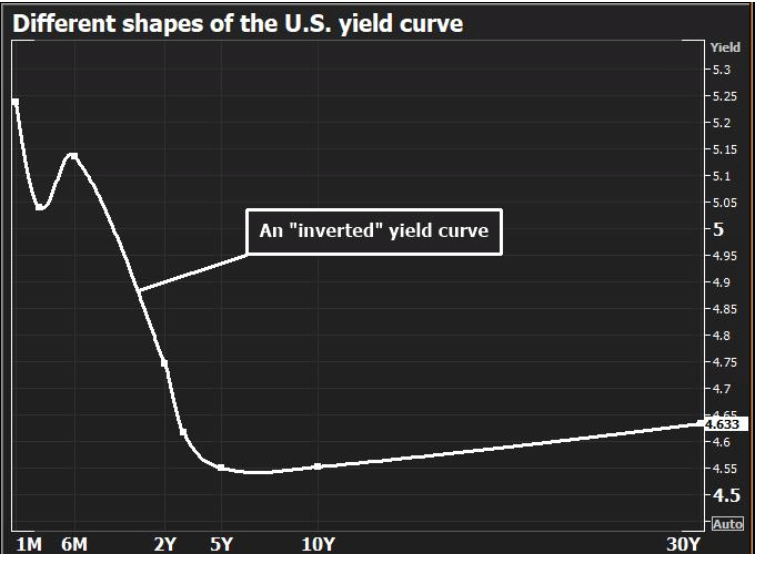
And now onto the main event, the inverted yield curve
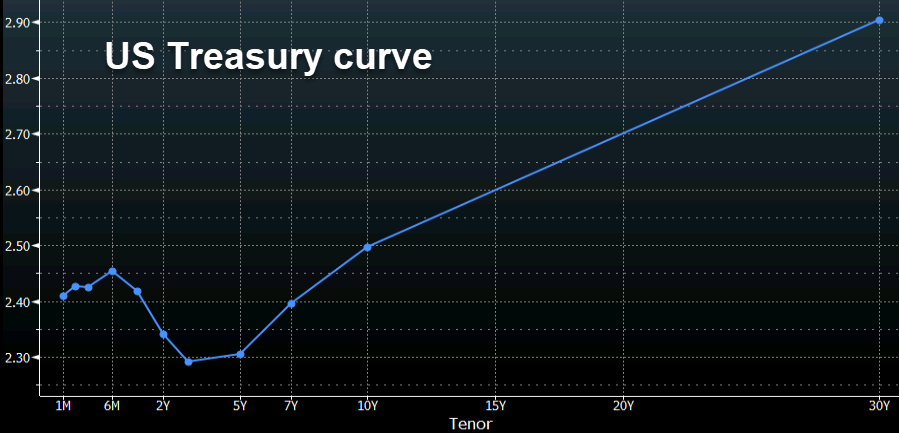
Well, we are now ready to discuss what the markets are focused on. In the chart below we can see an 'inverted yield curve'. This is where the yield offered for short term bonds is actually higher than the yield offered for a long term bond. The usual yield curve is 'inverted'. Long term bonds are bought as money moves out of equities into bonds. As an incentive, short term bonds offer higher yields to attract investors and experience strong demand as investors seek to guarantee yields as lower interest rates are expected going forward.
So, why does an inverted yield curve matter?
It matters so much because of history. Historically the inversions of the yield curve in US treasuries have preceded many of the U.S. recessions. Due to this historical correlation, the yield curve is often seen as an accurate forecast to the turning points of the business cycle e.g 2005, 2006, 2007 and late 2008. In fact, each of the past 9 recessions dating back to the 1950's have saw the 1Y -10Y yield invert approximately 14 months before a recession. All relatively straight forward so far, however, there is one key difference today that there hasn't been in the past. That is the impact of Quantitative Easing or 'QE'.
The unknown impact of QE on the inverted yield curve as a recession signal
The impact of QE is seen by some as a reason why an
inverted yield curve may not actually signal a recession in the way it has
done in the past. For those wanting some further reading I wrote a short
piece on this on Wednesday from a Bloomberg article I read and I found the
logic convincing. You can check it out here. It is
also worth noting that yield curves are not always reliable as a universal
signal. For example, both the UK and Germany have had inversions without
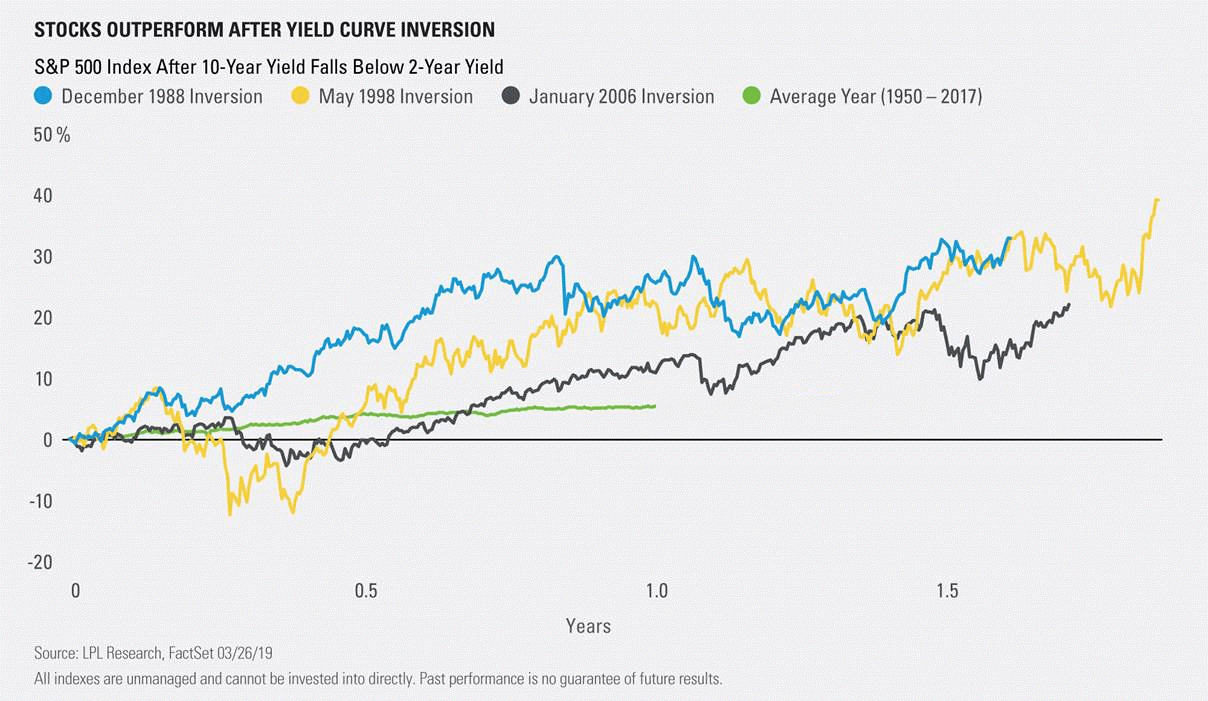
recessions. Furthermore, as the chart below from LPL research shows, stock
markets can still gain and the economy still grow in the time after the 10Y
yield falls below the 2Y yield curve has inverted.