Forex education from LegacyFX
In its most basic form, technical analysis is the way that a trader times their entry into the market. Technical analysis provides a way for traders to define what their risk will be on any given trade, as well enabling them to limit that risk.
Defining and limiting risk is a key component of risk management and proper risk management is the top priority ofall professional and consistently successful traders. The good news about technical analysis is that there are a number of widely followed tools which allow traders to place their trading strategies in the market.
A good grasp of technical analysis helps traders identify the best places to enter the market, take profit, and place their stop losses.
The first step in using technical analysis
Before considering the use of technical analysis a trader will want to first establish the current sentiment and fundamental conditions of the market. Sentiment analysis is simply understanding the current mood of the market while fundamental analysis is simply the ability to understand why the market is moving in a certain direction.
Armed with that knowledge a trader can pick the best currency pair/pairs in order to place their trading strategies using technical analysis as their means of entry, exit and stop loss. This article will consider four common aspects of technical analysis: Japanese candlestick patterns, moving averages, support and resistant levels and the Fibonacci retracement tool.
Japanese candlesticks
Emerging in the18th Century from Japan they are thought to have been developed by a legendary Japanese rice trader, called Munehisa Homma, in order to trade the future markets. There are a variety of candlestick names and patterns which show the movement of price within various time periods.
Has the price accelerated through a key level? Was the price heavily sold off from a certain level? Is price consolidating within a tight range? Japanese candlesticks provide information about the price at these key levels. When combined with sentimental and fundamentals analysis they provide clear clues to the direction of future price.
In the US Oil chart below the weekly bullish engulfing bar provided clear clues that higher prices were ahead.

Moving averages
Some of the most popular moving averages are the 50, 100, and 200 moving averages. These moving averages show what the average price has been over the last 50, 100, or 200 periods.
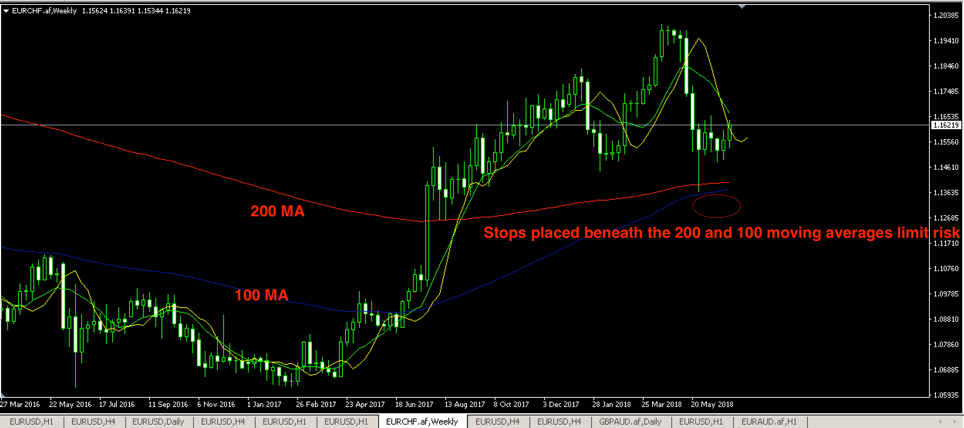
These can be very useful in providing good places to enter the market. Say, for example, that we know the Swiss National Bank has stated that it will support the EUR/CHF pair by buying it up to avoid the CHF becoming too strong.
Then, as in the chart below, the 200 moving weekly average provided a natural place for traders to enter long EUR/CHF positons. It also provided an excellent place for traders to place their stop beneath to limit their market risk.
Moving averages are most widely followed on the higher timeframes, like the daily and the weekly charts, and they become less reliable on the lower timeframes.

Support and Resistance
Arguably the most widely followed aspect of technical analysis is support and resistant levels. Support and resistance levels are key market levels where price has shown reaction in the past. As price moves towards those levels, at which price has reacted previously, they become significant as points in the market dividing buyers and sellers.
Here is an example in the weekly EUR/USD chart below. If you were wanting to place a longer-term swing trade around April 2017 to go long on the EUR/USD chart here you would place your entry on a pullback towards the Support level in the 1.0300 region. You would then place your stop on the other side of that level.
Your target could be the key overhead resistance at the 1.1500 level. This example is for a weekly chart trade, but support and resistance levels are followed widely on the smaller timeframes too and the same principles apply to using them to identify entry and exit prices.

Fibonacci retracement
The Fibonacci tool was named after a 13th Century Italian mathematician, Leonardo of Pisa, known as Fiboncacci. He was the son of a Pisan merchant and he traveled widely and traded frequently.
Fibonacci numbers are found extensively throughout the natural world and they are also used in trading as one of the most common trading tools. The way it is best used is in the instance when some news is released that is very bearish for the EUR/USD.
Traders who missed the original move will wait for price to retrace to a key Fibonacci level in order to rejoin the move. Below is a recent example of just such a situation when the European Central Bank surprised the markets by stating that it would not be increasing rates until September 2019. The EUR/USD sold off quickly.
Patient sellers waited for price to retrace to the 61.8% level in order to place their sell orders. Stops could be safely placed above the highs before the ECB broke their news.

By using these common technical analysis tools, traders are well equipped to identify places to enter, exit and place their stops. Technical analysis should not be used in isolation from sentimental and fundamental analysis, but when used in combination with them it becomes a powerful component in successful trading.
- Article provided by LegacyFX. Click here to visit the broker's site.


