GBP/USD explained
GBP/USD is the currency pair that shows the value of the British Pound against the US Dollar. The left side of the pair is called the base currency, in this case the GBP, and the right side is called the quote currency, in this case the USD. This exchange rate tells you how many US Dollars you need to buy one British Pound. For example, if the GBP/USD pair is trading at 1.1500, it means that you need 1.15 US Dollars to buy one British Pound. So, when the pair is going up in price, the British Pound is said to be appreciating or getting stronger and the US Dollar is depreciating or getting weaker, and vice versa when the pair is going down in price. The GBP/USD pair is also called “Cable” because of the transatlantic cable that enabled faster communications between London and New York back in the mid-19th century.
Analyzing the GBP/USD Candlestick Chart
There are different ways you can display the exchange rate price movements on a chart. The most common ways include a line chart or a bar chart, but the most popular and used one is the candlestick chart. The candlestick chart shows you instantly and in real time where the price has opened, closed and how much up and down it went on any given timeframe.

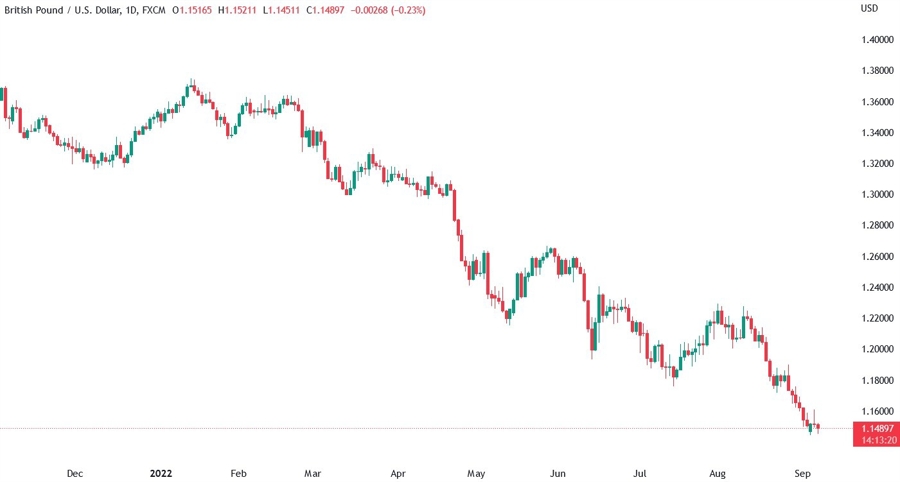
Let’s say you want to check GBP/USD price on a daily timeframe. You go to your charting software, select the timeframe and select the candlestick chart (if it’s not set by default). This is what you would see on tradingview.com
Should I Trade the GBP/USD?
GBP/USD can be a very good pair to trade when you have a monetary policy divergence between the two central banks backing the currencies, the Bank of England (BoE) for the GBP and the Federal Reserve for the USD. For example, if the Federal Reserve is raising interest rates and the Bank of England is cutting them or not doing anything, then you have a policy divergence and, in such cases, you would see the relative currency pair GBP/USD depreciate or going down. Below you can see the chart showing how in 2016 after the British people voted to leave the EU in the Brexit Referendum the GBP fell off a cliff. This is due to the expectations of the market that Brexit would be bad for the British economy and the Bank of England would soon cut interest rates. In fact, less than two months later the BoE indeed cut interest rates.

Another thing to remember is that the USD is considered as a safe haven currency. This means that in times of risk aversion in the market, the USD tends to appreciate against the GBP even if there’s no monetary policy divergence between the two central banks.
Best Sessions to Trade the GBP/USD
The best times to trade a forex pair is when you have the corresponding central banks going in the opposite directions with their monetary policies creating a divergence. The forex market is mainly driven by these interest rates differentials and risk sentiment. So, when you have a central bank raising interest rates and/or tightening monetary policy you would generally see its currency getting stronger. Then you just need to find a currency with a central bank that is cutting interest rates or keeping them low, find the relative pair for the two currencies and buying the strong currency against the weak one.
So, when you have the Federal Reserve raising interest rates in the US and the Bank of England cutting them or keeping them low, you can go short GBP/USD because the interest rate differential will be in favour of the USD. But when the Federal Reserve starts to cut interest rates, you would see GBP/USD going up, so you can go long, because the rates differential will start to decrease and traders and investors will start to look forward to better times ahead because the biggest central bank in the world, the Fed, is easing monetary policy which results in more spending and economic growth.
Moreover, you should know about the US Dollar Smile Theory. The dollar smile theory states that the USD tends to strengthen both when the US economy outperforms its peers but also when the US economy is extremely weak (like recession or extreme risk-off sentiment) or when there’s a global growth slowdown. There's a saying "when the US sneezes the world catches a cold". The US economy is the biggest in the world and US financial markets are the most stable and liquid ones. Therefore, it shouldn't surprise that when the US gets in trouble, the whole world is affected. So, when you expect this to happen, beware that you may see GBP/USD going down even if the BoE hikes rates faster than the Fed.
Why the GBP/USD is Important for FX Markets
Currency exchange rates are important for the respective countries. A weak currency can increase exports and thus growth because foreigners will have a stronger currency and more purchasing power leading to them demanding more goods and services from the country that has a weak currency. A too weak currency though can spell trouble because it may increase inflation and the central bank has a mandate of keeping inflation stable, so if it increases too much, the central bank will start to increase interest rates which will strengthen the currency. On the other hand, when the currency is too strong it increases imports and diminishes exports because foreigners will buy less goods and services because their purchasing power will be weaker. This can create a trade deficit (more imports than exports). That’s why GBP/USD is important for the Bank of England and the Federal Reserve.
Is the GBP/USD expected to go up or down?
In the current context of global slowdown, recessions, high inflation and cost of living crisis, the GBP/USD can only go down. Inflation in the UK is over 10% and the Bank of England looks still behind the curve prolonging the stagflation (weak growth and high inflation). On the other hand, the Federal Reserve is aggressively tightening monetary conditions and stating that it will keep at it even during a recession, which is something we have not seen in several decades. So, there’s a little policy divergence in this case even if not that stark like for example between the Fed and the BoJ. Moreover, in a global slowdown the USD appreciates as a safe haven currency, so even if the BoE was to get more hawkish and increase aggressively interest rates, the result would still be a weak GBP because the economy will just get worse and the safe haven status of the USD in this environment would trump the BoE moves.
GBP/USD vs USD/GBP
There’s no difference between GBP/USD and USD/GBP in terms of currency strength. The only difference lays in how the chart will be displayed and therefore the exchange rate you will see. In the chart below you can see that the two pairs have a perfect inverse correlation because you just swapped the positions of the currencies in the pair.

On the left axis you can see that the exchange rate for USD/GBP is 0.8702, which means that you need 0.8702 British Pounds to buy one US Dollar. On the right axis you can see the exchange rate for GBP/USD showing 1.1492, which tells you that you need 1.1492 US Dollars to buy one British Pound. So, in the end it doesn’t matter at all which currency pair you trade, but if you want to buy the US Dollar, then you will need to go long USD/GBP and short GBP/USD and vice versa if you want to buy the British Pound.
Why Has the GBP/USD Fallen Recently?
The Federal Reserve is aggressively tightening monetary conditions and stating that it will keep at it even during a recession, which is something we have not seen in several decades. As of now, with the inflation rate at 8.5%, the Fed increased rates to 2.50%. On the other hand, the Bank of England is not as aggressive as the Fed, and it even looks behind the curve when you think that interest rates are at 1.75% and inflation keeps on increasing and already surpassed 10%. Moreover, in a global slowdown the USD appreciates as a safe haven currency, so even if the BoE was to get more hawkish and increase aggressively interest rates, the result would still be a weak GBP because the economy will just get worse and the safe haven status of the USD in this environment would trump the BoE moves.
How to trade the GBP/USD
The best way to trade currencies in general is to have a fundamental idea for direction, which is generally based on macroeconomics such as central bank’s monetary policy, growth, inflation and so on, and technical analysis for risk management. For example, let’s say that you view the global slowdown and aggressive Fed as a tailwind for the USD in general. So, you will want to mainly take short positions. You also need to manage your risk though. Where can you enter in order to have a small risk exposure but a bigger profit potential? You can use technical analysis.
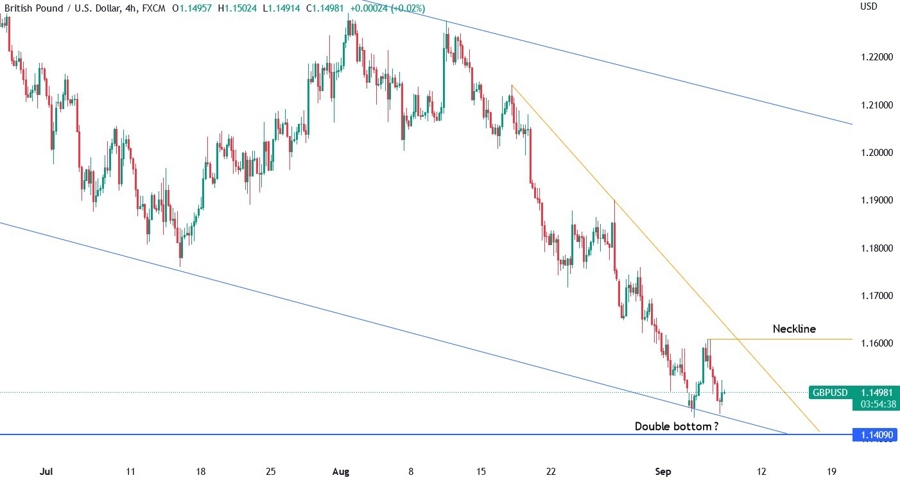
So, you open the GBP/USD chart and use technical concepts like support and resistance, trendlines, indicators and so on to decide where to open a trade. For example, in the chart below you can see how you could use the upward counter-trendline on the 4-hour timeframe as a signal of momentum switching again to the downside. So, once the price breaks the trendline, you could open a short position placing the stop loss above the recent high for protection. So, if the price broke the recent high you would have been just stopped out of the trade losing just a little. The possible gain though could have been much bigger as you would have pocketed three times more than you risked in that trade or you could even hold it for more if the reasons didn’t change.

What is the best platform to trade the GBP/USD?
You can trade GBP/USD or any other Forex pair with a broker. Always choose a good, reputable, and regulated broker to avoid unnecessary problems. When you open a trading account with a broker, you will have to deposit money to be able to trade and then use the broker trading platform to execute your trades. Most retail brokers let you trade on MetaTrader 4 or MetaTrader 5, which are two of the most famous and popular trading platforms among retail traders. Most retail brokers offer CFD trading for Forex, although you can also trade GBP/USD via other derivatives like futures or options that are more expensive than CFDs, or you can buy ETFs like those from WisdomTree offering long or short exposure to GBP/USD although they have less liquidity, so they are not fit for trading.
GBP/USD Analysis
FUNDAMENTAL ANALYSIS: In the current environment of global slowdown, recessions, high inflation and aggressive monetary tightening, GBP/USD looks like a one-way street to the downside as the USD is favoured in times of risk aversion and stress in the markets. The BoE is on its tightening path, but it looks as if it’s too cautious and has not yet accepted that it needs to ignore a recession and tighten aggressively monetary policy to combat inflation and keep inflation expectations anchored. Back in May for example, the BoE forecasted a double-digit inflation by year-end but still hiked rates by a mere 25 bps. This is not a central bank that is serious about its mandate of price stability. But, even if they start to go aggressive and increase the magnitude of their interest rates hikes, the end result will still be a depreciation in GBP/USD because in a synchronised global slowdown, traders and investors prefer the safety of the USD. The Fed, on the other hand, is “all in” in its inflation fight stating and repeating endlessly that they will “keep at it” even if there’s a recession and they already expect some pain in the economy, which will not make them pause or reverse policy until inflation has showed clear evidence of getting back to their 2% target. So, for the next 3-6 months, GBP/USD is still a sell on rallies.
TECHNICAL ANALYSIS: On the monthly timeframe, we can see how the GBP/USD came back all the way down to the Covid recession levels at 1.1410. A break of that level opens the door for further drop and may even touch the all-time low level from the 1985 at 1.0520. This just shows how incredibly big and bad the current times are.

On the daily timeframe, we can see how the price looks like forming a short-term bottom near the Covid recession low at 1.1410 and could be trading in a downtrend channel. If the low holds and price starts to make new short-term highs, we may see the pair pulling back to the 1.18-1.20 range before seeing new lows.

On the 4-hour timeframe, we can see that for now the downtrend is intact. The next big event is the US CPI report next week. In case of a big miss on expectations, GBP/USD may get a relief rally breaking the trendline and the neckline confirming the possible double top forming near the Covid recession low. The rally may even extend to roughly the 1.2000 area.
GBP/USD Correlation
GBP/USD has a correlation with global growth. For the Dollar Smile Theory, the USD appreciates both when there’s a synchronised global slowdown and when the US economy outperforms its peers. On the other hand, when there’s global growth USD weakens and currencies like GBP, EUR, AUD, CAD and so on appreciate against it. To show this correlation, we can take the US ISM Manufacturing PMI, which is correlated with Global PMIs since the US is the biggest economy in the world, and compare it with GBP/USD chart. Below you can see how the changes in the ISM PMI (orange line) correlate with GBP/USD (blue line). Thus, if you expect global growth to slow down, you can go short GBP/USD and vice versa if you expect a stable or higher global growth.

Another important correlation you should be aware of is that between the currency pair and the yield spread. Generally, investors care about three things: return, risk and liquidity. Bonds interest rates are called yields, that’s how much you will get every year if you buy the relative bond. So, if you can get a higher return in a country than another, you would take the chance, right? But investors also care about the risk and liquidity. The risk is that you may get a lower return compared to inflation and/or future interest rates and liquidity is how easy and fast it is to convert an asset into cash. So, if those last two things are seen as bad for an investor, then even if the return is higher, the investor would shy away from putting his money into that country.
Below, you can see the yield spread between the UK and the US bonds (blue line) and GBP/USD exchange rate (orange line). You can see how the currency pair is correlated with the yield spread. Sometimes though there are divergences and those happen because of other fundamental things happening in the economies or the world. That’s why it’s important for you to keep up with the ongoing developments in the world to always be aware of what’s going on and what may happen next. The current divergence is caused by a higher inflation in the UK compared to the US and the economic performances between the two countries. In fact, the real yields (nominal yields – inflation expectations) in the UK are negative, but they are positive in the US. That explains the divergence you see in the chart.


