What is USD/CAD?
USD/CAD is the currency pair that shows the value of the US Dollar against the Canadian Dollar. The left side of the pair is called the base currency, in this case the USD, and the right side is called the quote currency, in this case the CAD. This exchange rate tells you how many Canadian Dollars you need to buy one US Dollar. For example, if the USD/CAD pair is trading at 1.2980, it means that you need 1.2980 Canadian Dollars to buy one US Dollar. So, when the pair is going up in price, the US Dollar is said to be appreciating or getting stronger and the Canadian Dollar is depreciating or getting weaker, and vice versa when the pair is going down in price. The Canadian Dollar is also called “Loonie” because of the picture of a loon on one side of the 1 Canadian Dollar coin.
What are the most important USD/CAD charts to follow?
There are different ways you can display the exchange rate price movements on a chart. The most common ways include a line chart or a bar chart, but the most popular and used one is the candlestick chart. The candlestick chart shows you instantly and in real time where the price has opened, closed and how much up and down it went on any given timeframe.

Let’s say you want to check USD/CAD price on a daily timeframe. You go to your charting software, select the timeframe and select the candlestick chart (if it’s not set by default). This is what you would see on tradingview.com

Is USD/CAD a good pair to trade for beginners?
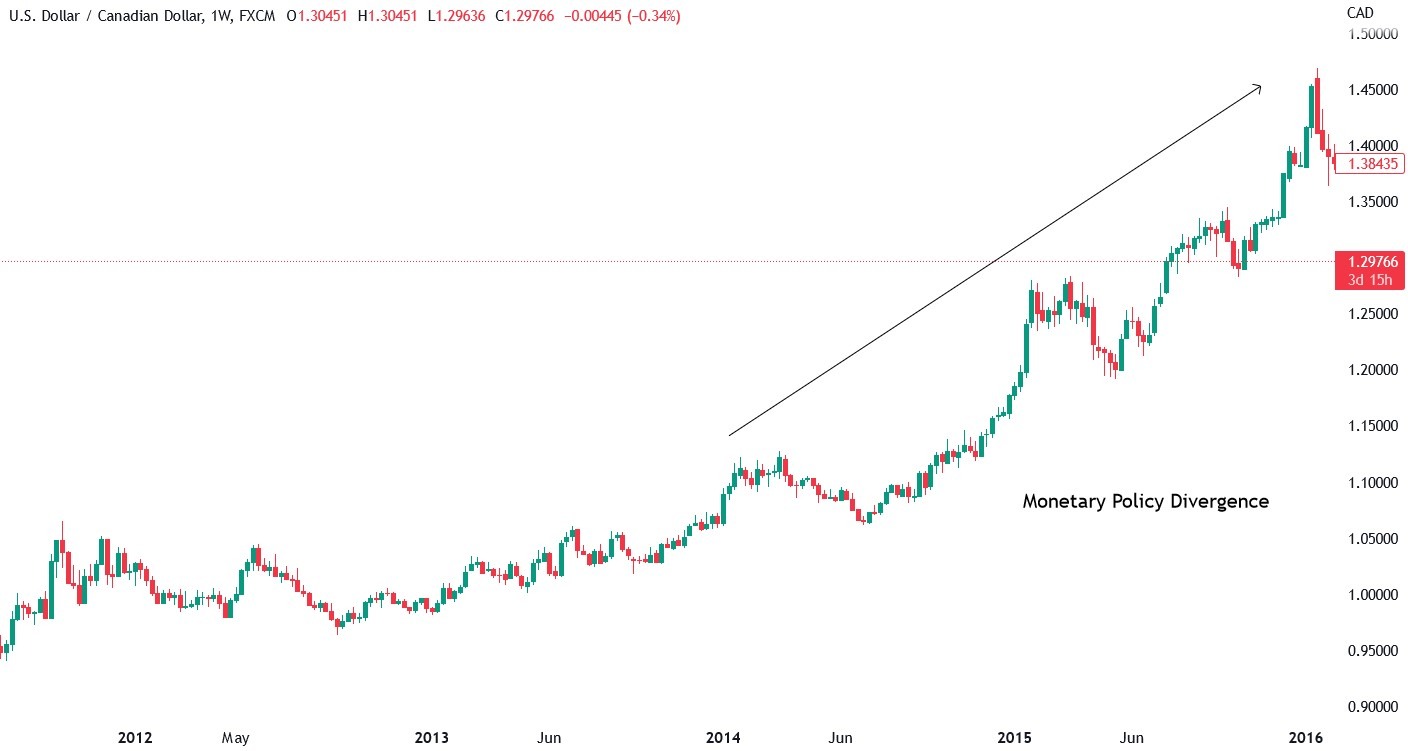
USD/CAD can be a very good pair to trade when you have a monetary policy divergence between the two central banks backing the currencies, the Federal Reserve for the USD and the Bank of Canada (BoC) for the CAD. For example, if the Federal Reserve is about to start tightening its monetary policy raising interest rates and the Bank of Canada is cutting them or not doing anything, then you have a policy divergence and, in such cases, you would see the relative currency pair USD/CAD appreciate or going up. Below you can see the chart showing how from 2013 to 2016 after the infamous “taper tantrum”, as it was called when the Fed signalled that it would scale back its asset purchases, the market expected the Fed to raise rates in the near future, but the Bank of Canada remained dovish creating the divergence and a rally in the pair of more than 40%.
Another thing to remember is that the USD is considered as a safe haven currency. This means that in times of risk aversion in the market, the USD tends to appreciate against the CAD even if there’s no monetary policy divergence between the two central banks.
What session is best to trade the USD/CAD?
The best times to trade USD/CAD is during the North American Session, also called the New York Session. During this session not only Canadian and US traders are active, but it’s also when we see major economic releases for both countries. Moreover, the first part of the session overlaps with the European Session, therefore liquidity is at its peak. For example, if you have a bullish view on the pair and you see that some important economic data comes out good for the US economy but bad for the Canadian one, you can trade this divergence and go long the USD/CAD pair.
Is USD/CAD an important pair?
Currency exchange rates are important for the respective countries. A weak currency can increase exports and thus growth because foreigners will have a stronger currency and more purchasing power leading to them demanding more goods and services from the country that has a weak currency. A too weak currency though can spell trouble because it may increase inflation and the central bank has a mandate of keeping inflation stable, so if it increases too much, the central bank will start to increase interest rates which will strengthen the currency. On the other hand, when the currency is too strong it increases imports and diminishes exports because foreigners will buy less goods and services because their purchasing power will be weaker. This can create a trade deficit (more imports than exports). That’s why USD/CAD is important for both the Federal Reserve and the Bank of Canada.
Will USD/CAD go up or down?
In the current context of global slowdown, recessions, high inflation and cost of living crisis, the USD/CAD should maintain the uptrend. Although the Bank of Canada is aggressive in its monetary tightening to combat inflation, we are already seeing pain in the economy and job losses starting to increase. Canada is also a major oil exporter and in a global slowdown with less demand, oil prices should fall, decreasing Canada’s revenues. On the other hand, the Federal Reserve is as hawkish and aggressive as the Bank of Canada and it has already stated many times that it won’t pause nor cut rates until the job of bringing inflation back to target is done, even if there is a recession. So, there’s no policy divergence in this case, but as mentioned earlier, the USD tends to be preferred in times of uncertainty and stress in the markets as a safe haven currency.
How does oil impact USD/CAD?
One of the most famous correlations you will hear about in the FX market is the one between Oil and CAD. It’s based on the fact that Canada is a major Oil exporter, so the higher the price of Oil and the better for Canadian economy and its currency.
Correlations though can lag and decouple, so they shouldn’t be taken as absolutes. Below you can see the inverse correlation between USD/CAD (blue line) and Oil (orange line). Moreover, you can see how the correlation decoupled in 2022 with Oil prices rising but USD/CAD instead of falling, actually risen.

This is because in reality Oil is more inversely correlated with the USD. On one hand, because most commodities are priced in US Dollars, so the higher the value of the USD the more expensive it becomes to buy Oil, and eventually that leads to less demand and lower Oil prices. On the other hand, Oil is inversely correlated with global growth, so when there’s a global slowdown, oil prices tend to fall as less demand weighs on the commodity. The USD is positively correlated with global slowdown as it appreciates as a safe haven currency. In fact, if you look at the chart below, you can see that Oil is inversely correlated with the USD.

This is just to show that you shouldn’t look at the correlation alone but have a bigger picture view on what drivers can impact USD/CAD and not taking the correlation with Oil prices for granted.
Will a US recession affect USD/CAD?
One thing any FX trader should know about is the “Dollar Smile Theory”. The dollar smile theory states that the USD tends to strengthen both when the US economy outperforms its peers but also when the US economy is extremely weak (like recession or extreme risk off sentiment) or when there’s a global growth slowdown. There's a saying "when the US sneezes the world catches a cold". The US economy is the biggest in the world and US financial markets are the most stable and liquid ones. Therefore, it shouldn't surprise that when the US gets in trouble, the whole world is affected. This is also true for USD/CAD, in fact, even if the Bank of Canada is slightly more hawkish than the Fed in its monetary tightening, we saw the USD/CAD pair going up since the second half of 2021.
How to trade USD/CAD?
The best way to trade currencies in general is to have a fundamental idea for direction, which is generally based on macroeconomics such as central bank’s monetary policy, growth, inflation and so on, and technical analysis for risk management. For example, let’s say that you view the global slowdown and aggressive Fed as a tailwind for the USD in general. So, you will want to mainly take long positions. You also need to manage your risk though. Where can you enter in order to have a small risk exposure but a bigger profit potential? You can use technical analysis.
So, you open the USD/CAD chart and use technical concepts like support and resistance, trendlines, Fibonacci ratios, indicators and so on to decide where to open a trade. For example, in the chart below you can see how you could use the swing support coupled with a 61.8% Fibonacci retracement level as an entry for a trade. You could place a stop loss below the retracement level and a previous swing point, so your loss would be little and limited. Your target could have been the 161.8% Fibonacci extension level, giving you a reward five times bigger than your risk.

Where can I trade USD/CAD?
You can trade USD/CAD or any other Forex pair with a broker. Always choose a good, reputable, and regulated broker to avoid unnecessary problems. When you open a trading account with a broker, you will have to deposit money to be able to trade and then use the broker trading platform to execute your trades. Most retail brokers let you trade on MetaTrader 4 or MetaTrader 5, which are two of the most famous and popular trading platforms among retail traders. Most retail brokers offer CFD trading for Forex, although you can also trade USD/CAD via other derivatives like futures or options that trade on exchanges and are more expensive than CFDs.
USD/CAD Correlation
USD/CAD as many other major pairs has a correlation with global growth. For the Dollar Smile Theory, the USD appreciates both when there’s a synchronised global slowdown and when the US economy outperforms its peers. On the other hand, when there’s global growth USD weakens and currencies like CAD, GBP, EUR, AUD, and so on appreciate against it. To show this correlation, we can take the US ISM Manufacturing PMI, which is correlated with Global PMIs since the US is the biggest economy in the world and compare it with USD/CAD chart. Below you can see how the changes in the ISM PMI (orange line) have an inverse correlation with USD/CAD (blue line). Thus, if you expect global growth to slow down, you may want to look more for longs on USD/CAD and vice versa if you expect a stable or higher global growth.

Another important correlation you should be aware of is that between the currency pair and the yield spread. Generally, investors care about three things: return, risk and liquidity. Bonds interest rates are called yields, that’s how much you will get every year if you buy the relative bond. So, if you can get a higher return in a country than another, you would take the chance, right? But investors also care about the risk and liquidity. The risk is that you may get a lower return compared to inflation and/or future interest rates and liquidity is how easy and fast it is to convert an asset into cash. So, if those last two things are seen as bad for an investor, then even if the return is higher, the investor would shy away from putting his money into that country.
Below, you can see the yield spread between the US and the Canadian bonds (blue line) and USD/CAD exchange rate (orange line). You can see how the currency pair is correlated with the yield spread. Sometimes though there are divergences and those happen because of other fundamental things happening in the economies or the world. That’s why it’s important for you to keep up with the ongoing developments in the world to always be aware of what’s going on and what may happen next.

Lastly, as mentioned earlier, one of the most famous correlations you will hear about in the FX market is the one between Oil and CAD. It’s based on the fact that Canada is a major Oil exporter, so the higher the price of Oil and the better for Canadian economy and its currency. Correlations though can lag and decouple, so they shouldn’t be taken as absolutes. Below you can see the inverse correlation between USD/CAD (blue line) and Oil (orange line). Moreover, you can see how the correlation decoupled in 2022 with Oil prices rising but USD/CAD instead of falling actually risen.

This is because in reality Oil is more inversely correlated with the USD. On one hand, because most commodities are priced in US Dollars, so the higher the value of the USD the more expensive it becomes to buy the Oil, and eventually that leads to less demand and lower Oil prices. On the other hand, Oil is inversely correlated with global growth, so when there’s a global slowdown, oil prices tend to fall as less demand weighs on the commodity. The USD is positively correlated with global slowdown as it appreciates as a safe haven currency. In fact, if you look at the chart below, you can see that Oil is inversely correlated with the USD.

This is just to show that you shouldn’t look at the correlation alone but have a more big picture view on what drivers can impact USD/CAD and not taking the correlation with Oil prices or any other instrument for granted.

