
Around 70% correlation-
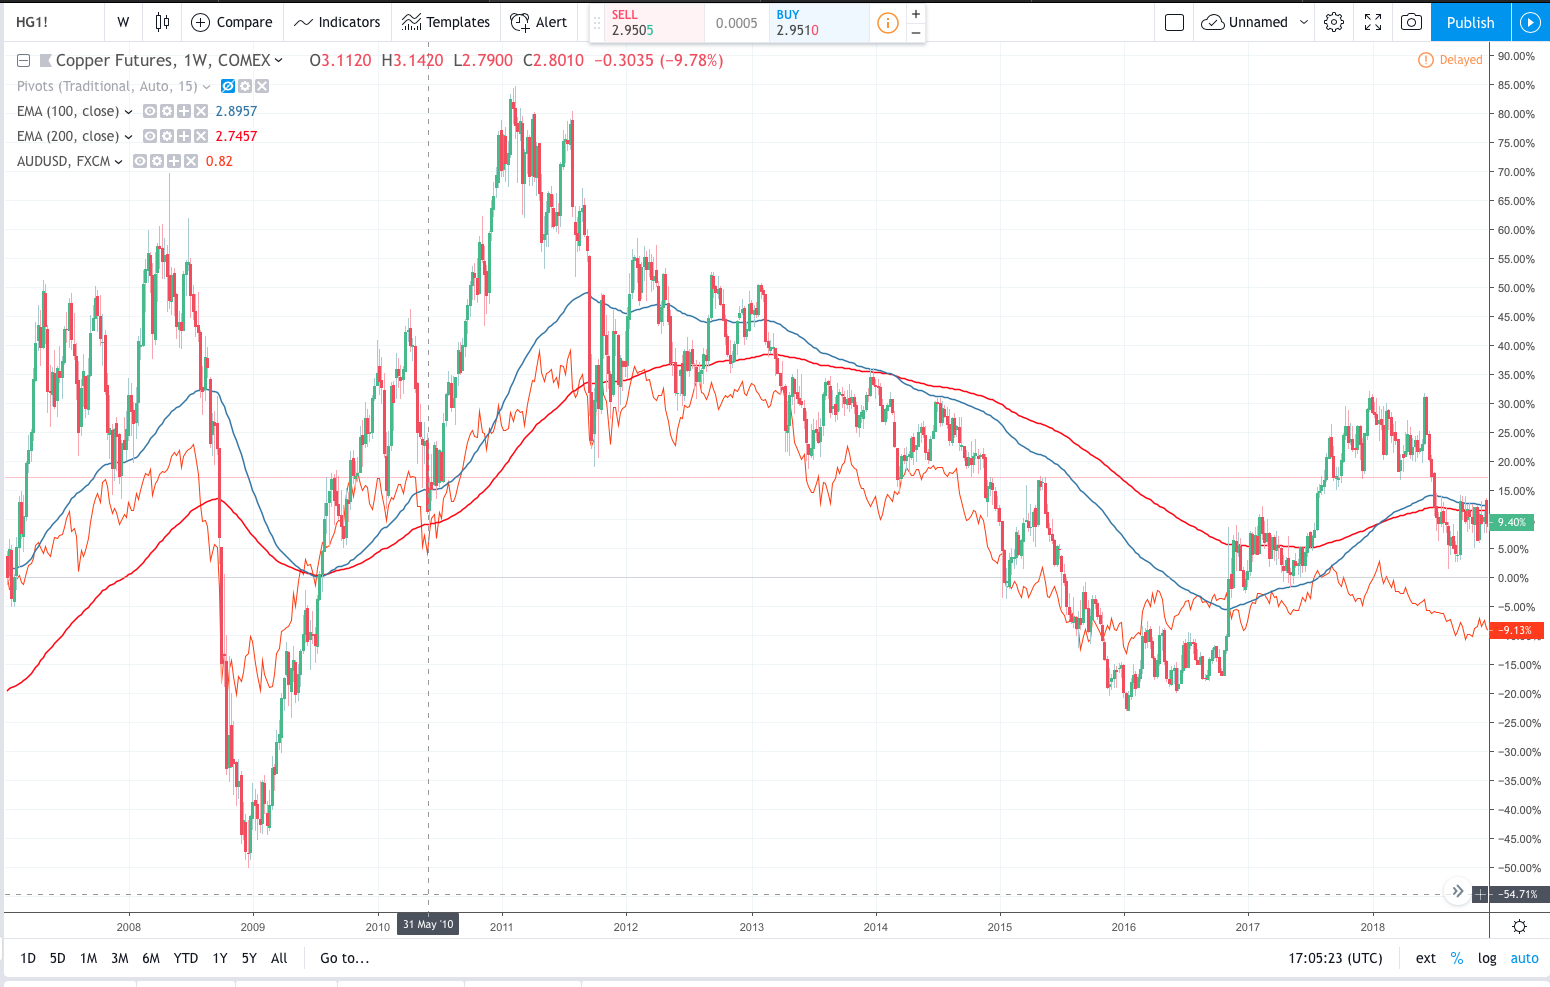
The Australian dollar and Copper have around a 70% correlation. If you look at the weekly chart below you can see that they tend to move pretty closely with one another. AUDUSD is the red lone and Copper (HG!) is the candlestick chart.
Another key relationship is between Copper and the Chinese economy. China uses about 50% of the globe's usage of Copper, so yesterday's weak PMI data out of China and a strong copper market was a divergence highlighted in Bloomberg's markets Live blog I read yesterday. The weak PMI"S out of China, as reported by our very own wonderful Eamonn, will be crucial in setting sentiment for the global industrial sector. Bloomberg reported that the current strength of the copper market may be a result of falling LME stockpiles propping up prices.
So, when you look at the Chinese manufacturing PMI data in comparison with the price of Copper then you can see the issue. Copper is rising while the PMI's are falling and usually they move pretty much in tandem. Check out the chart below -

Opportunity knocks. Copper prices (and AUD) look very vulnerable to more downside. The Us-China trade 'war' development will obviously present as either a catalyst for or against this trade. However, a divergence is in place, so a correction may be around the corner. One to watch.

