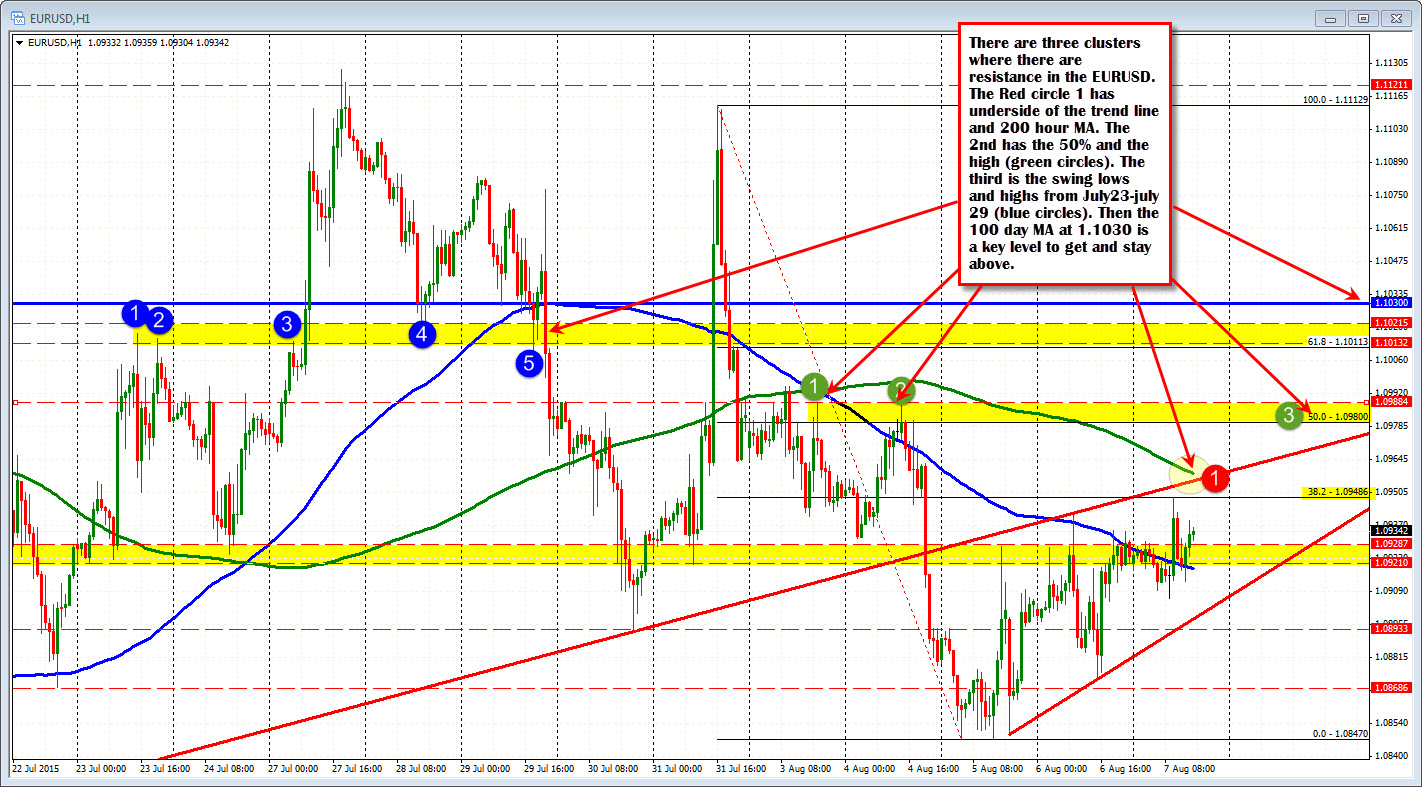
Risk is high
The US employment report is always a risky event. When you have 300 million people and plus or minus 50-100K can make a big difference, that increases not only market risk but liquidity risk and event risk. Therefore, understand it is more of a gamble before the event.
After the event and liquidity risk dies down, there are the potential for more opportunity. The key technical levels often provide a road map in defining and limiting risk.

For the EURUSD what are the levels to eye and why.
On a strong number - >230K, upward revisions to prior months, lower employment, hourly earnings >0.3% - the downside will be explored for the EURUSD. The Fed will be on target to tighten in September. Key levels include:
- 1.0919: This is the 100 hour MA (blue line in the chart above). This is also the low level from a number of swing lows and highs going back to July 16th. Moving below this level will not be difficult given the expectations of a Fed tightening.
- 1.0893-96: This is trend line support and the swing low from July 30
- 1.0868: Go back to July 20 and it was near a high. On July 22 it was a low correction point. The price took off from there. On Wednesday this week, the price traded below that level but could not keep momentum going . Yesterday the low got to 1.0872 - just ahead of this level.
- 1.0847: Have three lows from Wednesday there. Low price for the week. A move to this level would only imply a 100 pip range for the day. The average over the last 22 trading days is down to 109 pips. So this is a doable target
- 1.0807-18: The 1.0818 was the low from May 27. The 1.0807 was the low from July 20 (see chart below). A move below this level opens up the downside for the EURUSD bearishness.

On a weaker number - < 200 with lower revisions, >5.3% unemployment rate and < 0.2% hourly earnings - the EURUSD should rally. The Fed will continue to be a mystery but the market will likely assume a delay in liftoff. Key upside levels include:
- 1.0948. This is the 38.2% of the move down from the July 31 high
- 1.0955-649. This area has trend line, 200 hour MA and the 50% off the daily chart move (March low to the May 2015 high)
- 1.0980-88: 50% of the move down from July 31 high and high from August 3/4.
- 1.1011-21: Swing highs and lows from July 23 (see hourly chart) and July 28. ON July 29, went tumbling through this level. On July 31, rallied through it and tumbled through it too (see hourly chart). A move to this area would be 116 pip trading range for the day which is doable given the 22 day average of 109 pips currently.
- 1.1030. The 100 day MA. This is not that far from the prior resistance area making this whole area a key line in the sand area. If the buyers are to take control going forward, a move above and staying above this area will be key.
With it being August and staffs at places likely thinned (we are seeing that in the price action of late), traders have to be aware that the market may not act normally give a bullish or bearish number (PS. if the number is neutral expect choppy action). So watch your levels.
Good fortune with your trading.


