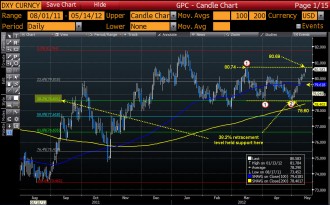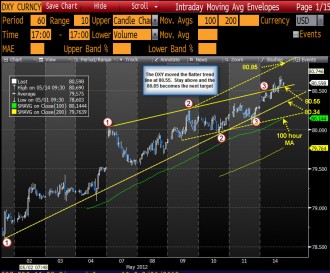
The US Dollar Index (DXY) has been moving steadily higher after bottoming on May 1st. The index has been up on 9 of the last 11 trading days. The move has taken the index from a low of 78.60 to the high today of 80.69.
On the move higher,
- The price initially bottomed at the 38.2% of the move up from the August 2011 low. That level came in at the 78.60 level and the low on May 1st came in precisely at this key support level.
- Mid trend, the price pushed above the 100 day MA (blue line in the chart above) at the 79.62 area. The move above this level gave the longer term traders more confidence in the upside,
- The price today is pushing against the next key target at the 80.74 level (high from March 2012). I would expect some profit taking against this level.
Although there should be sellers against the resistance today (and a potential correction down), given the trend like move this month, a break above the level should not be ignored. The index has been in a non-trending range for the last 4 1/2 months. Anticipating a break out and continuation of the trend would therefore not be surprising. The next key target on the daily chart would be the high of the year at 81.78 the target.
Looking at the hourly chart, the index moved above an upper trendline today at the 80.56 area. Stay above this level and the bulls are still in firm control. A move back below the level today has 80.34 and the 100 hour MA at the 80.15 area. Trend line support also comes slicing across at this area. If the trend is to continue higher, traders would like to see this MA and support trend line to hold on a corrective move lower. A move below would indicate a shift in the trader sentiment for the dollar. The price has been above the 100 hour MA since May 2nd.


