
Philadelphia Fed manufacturing index for November2021
- prior was 23.8.
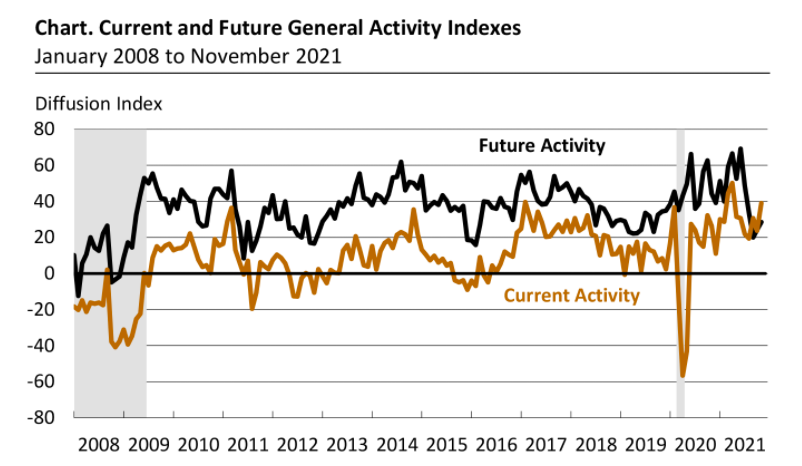
- manufacturing index 39 highest since April
- New orders 47.4 versus 30.8 last month.
- Employment 27.2 versus 30.7 last month.
- Average workweek 30.6 versus 27 point last month.
- Prices paid 80 versus 70.3 last month.
- prices received 62.9 versus 51.1 last month
- unfilled orders 27.4 versus 12.7 last month
- delivery times 35.7 versus 32.2 last month
- inventories 13.5 versus 18.8 last month
Future activity(six month forward) 28.5 verse 24.2 last month.
- new orders 28 versus 26.2 last month
- employment 49.3 versus 37.5 last month
- average workweek 9.7 versus 27.2 last month
- prices paid 63.9 versus 64.1 last month
- prices received 59.4 versus 58 point last month
- unfilled orders -0.8 versus -18.1 last month
- delivery times -1.6 versus -1.7 last month
- inventories 14.1 versus 23.6 last month
For the full report click here
A strong report from the regional Federal Reserve district
Special questions forecast for next year for your firm:
- prices your firm will receive for its own goods and services sold. 5.3 versus 5.0 from August 21
- compensation your firm will pay per employee for wages and benefits. 4.8 versus 4.0 in August 2021
Special questions for consumers:
- prices US consumers will pay for goods and services over the next year 5.0 versus 5.0 in August
- prices US consumerss will pay for goods and services over the next 10 years 3.5 versus 3.0 in August
From the Philadelphia Fed:
Responses to the November Manufacturing Business Outlook Survey suggest continued expansion for the region's manufacturing sector. The indicators for current activity, shipments, and new orders all increased from last month. Additionally, the firms indicated overall increases in employment and more widespread increases in prices paid and received. The survey's future indexes continue to suggest expected growth over the nextsix months

