
The first look at third quarter 2019 US GDP:
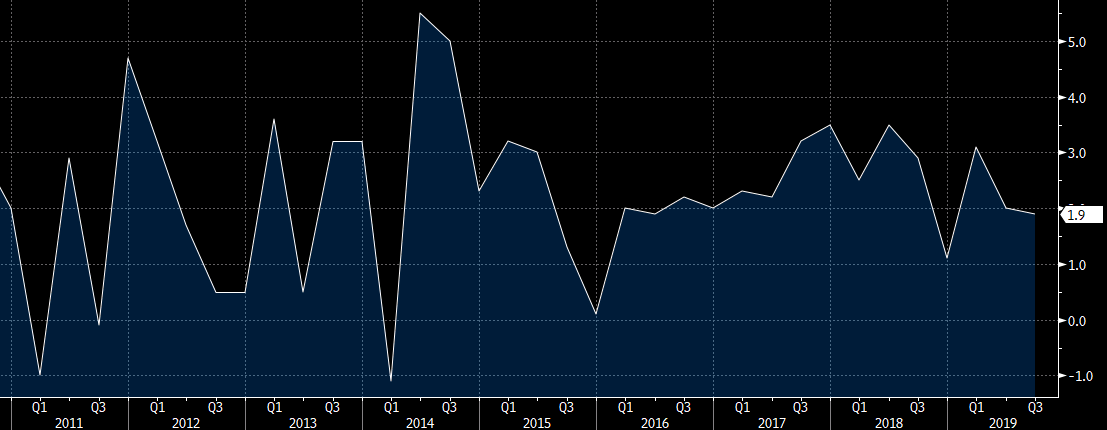
- The final Q2 reading was +2.0%
- Personal consumption +2.9% vs +2.6% expected
- Prior consumption 4.6%
- GDP price index 1.7% vs 1.9% exp
- Core PCE q/q +2.2%
- GDP deflator 1.6% vs 1.9% exp
The inflation side of this report was significantly softer than anticipated and that's the reason for the bulk of the upside beat.
Percentage contributions:
- Personal consumption added 1.93 pp
- Gross private investment -0.27 pp
- Inventories -0.05 pp
- Net exports -0.08 pp
- Government consumption +0.35 pp
The consumer is solid and inventories didn't skew anything but the numbers are a bit softer than they look. It's rare that net exports aren't a drag and the trade deficit isn't going away any time soon. At some point, governments will have to pull back on spending too.

