

The August US jobs report is due Friday at 8:30 am ET. It's a clear case of where 'bad news is good news' as the market wants to see some cooling in hiring so the Fed can slow rate hikes. In addition, there will be a very close watch on wage data.
- Consensus estimate +300K
- Private +300K
- July +528K
- Unemployment rate consensus estimate: 3.5% vs 3.5% prior
- Participation rate prior 62.1%
- Prior underemployment U6 6.7%
- Avg hourly earnings y/y exp +5.3% y/y vs +5.2% prior
- Avg hourly earnings m/m exp +0.4% vs +0.5% prior
- Avg weekly hours exp 34.6 vs 34.6 prior

Here's the August jobs story so far:
- ADP employment 132K vs 300K expected under new methodology
- ISM manufacturing employment 54.2 vs 49.9 prior
- Challenger Job Cuts rose 30.3% in August vs July’s 36.3%
- Philly employment 24.1 vs 19.4 prior
- Empire employment 7.4 vs 18.0 prior
- Initial jobless claims survey week 245K vs 261K a month ago
- ISM services employment not yet released
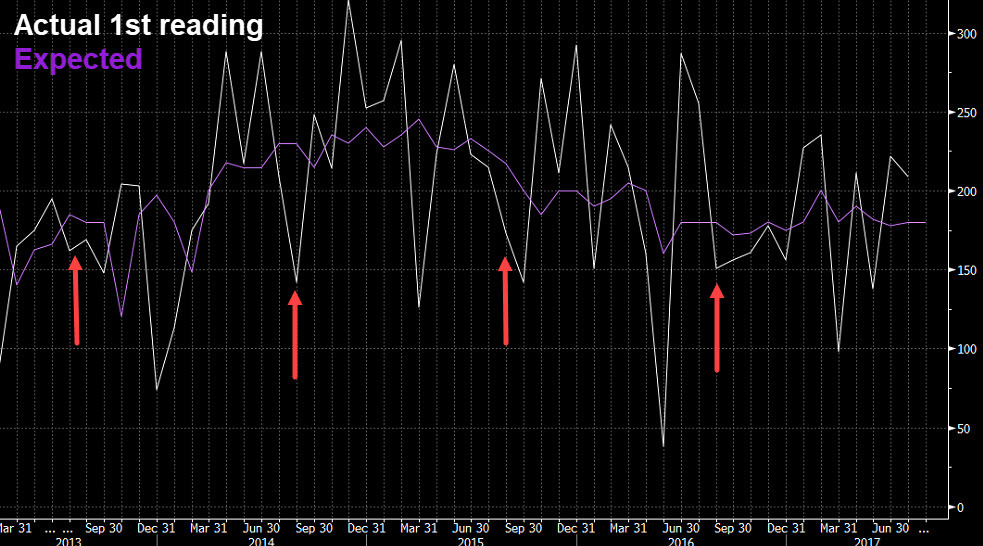
Here's why you might want to ignore all those numbers: There's a very strong seasonal (annual?) pattern of August non-farm payrolls missing estimates to the downside. It's something I wrote about last year and for several years before. What happened last year? August 2021 non-farm payrolls came in at +235K compared to +750K expected.
In fact, it's missed before revisions in 17 of the past 21 years to the downside. Over the past seven years, the miss has been about 100K on average and it's still nearly 50K if last year is not included.
Here's a chart showing a bunch of the misses in recent history.
I think the Sept 13 CPI report is far more important to the Fed's calculus on a 50 or 75 bps hike but a soft jobs report could offer some relief for stocks and weight on the US dollar.

