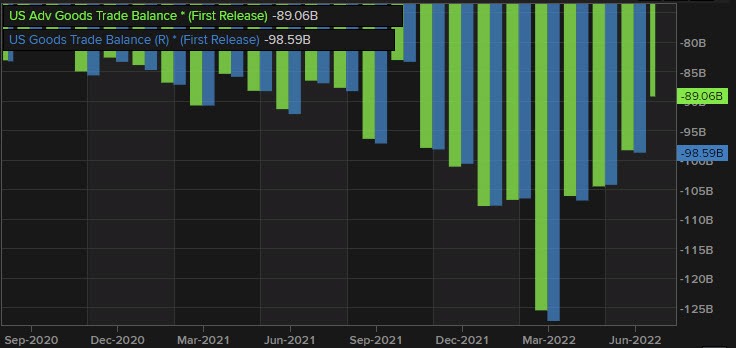
US goods trade balance
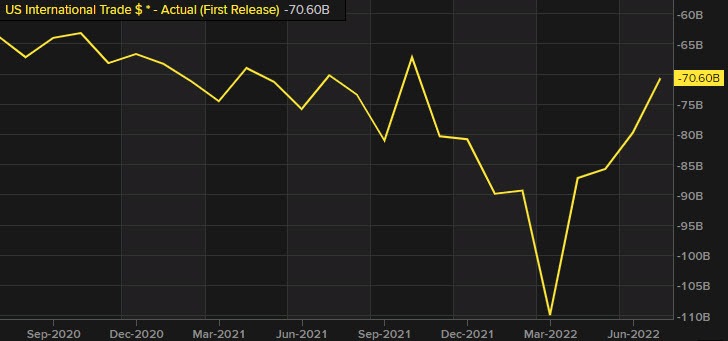
- Trade balance for July 2022 -70.70B vs -70.3B estimate
- Goods trade balance (revised) for July -90.19B vs -89.06B preliminary. Last month -98.59B
- Services $20.44 billion surplus
- exports -0.2% vs. Junes -1.7%. Total exports 259.29 billion vs. 258.76 billion in June.
- imports -2.9% vs. June -0.2%. Total imports 329.94 billion vs. 339.64 billion
- China trade deficit $-34.4 billion vs. June deficit of $-36.95 billion
- capital goods imports $72.78 billion vs. June $72.29 billion
- oil imports price $102.27 vs. June $104.81. The prices up 56.8% from July 2021
The US runs a trade deficit on goods and a trade surplus of services. The goods trade deficit is at the lowest level since October when it reached $-82 billion. For the overall trade balance including services is at the lowest level since October 2021 when it reached -$67.1 billion.

US international trade deficit
/Inflation


