
Looking to go out for the year at the highs
The AUDUSD is trading at the highest level going back to April 2018, surpassing the June 2018 high today at 0.7676 in the process. The high price reached 0.76855. The price trades just off the high at 0.7680.
For the year, the low to high trading range saw the pair move from a low in March at 0.5509 up to the high today at 076855, or 2176 pips. That range is the highest over the last 10 years and the highest since 2010 when the range was 2189 pips. The average over the last 10 years is 1345. The median is 1337 pips. So the range this covid year is 831 pips above the average. That's a pretty big year for the pair.

Looking at the change for the year, the closing level in 2019 came in at 0.7015. With the price at 0.7780, the gain for the year is 765 pips or 10.9%. That gain came after a fall of some 21.4% from the end of year level to the March low. Since the low, the price has risen by a whooping 39.5%.
Technically in 2020, the pairs plunge took the price below a swing area between 0.6662 and 0.66843 in February. After a retest of the floor on March 9, the price tumbled the 1175 pips to the low on March 19 (just 10 calendar days).
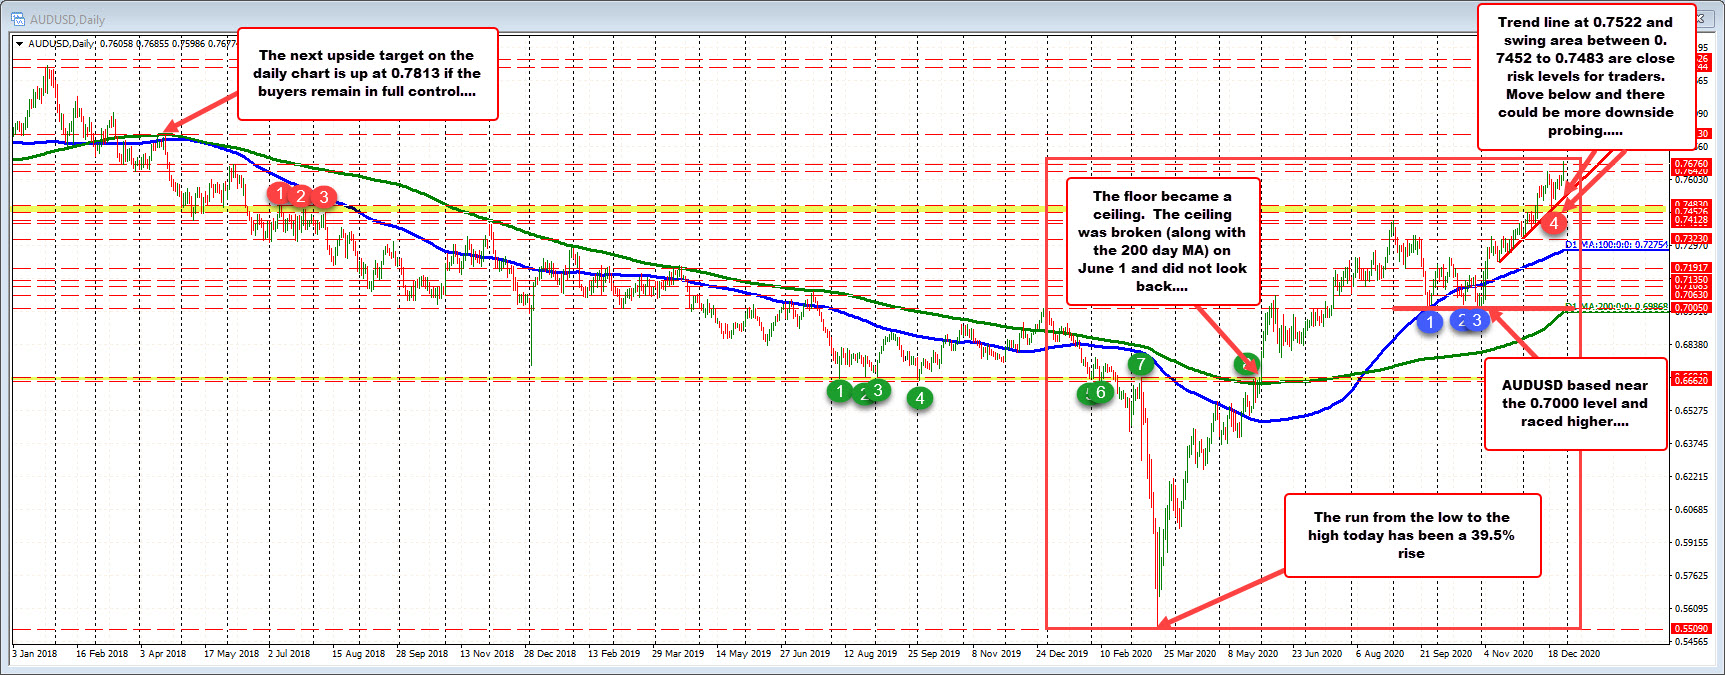
The rise off the low retraced to 100 day MA (blue line) and then above that MA line in May. The 200 day MA (green line) and the swing area between 0.6662 and 0.66843 was then retested and broken on June 1. The pair found support in September, October and November near the 0.7000 level, before basing and racing to the high reached today at 0.76855 (around 685 pip move higher). On the dips to the 0.7000 area, the pair did fall back below the 100 day MA (blue line), but in early November, the pair moved back above that MA and ran to the upside. The 100 day MA is down at 0.7275 currently.
The year is ending with a strong, bullish bias. A lower trend line cuts across at 0.7522 (and rising). Swing highs between 0.7452 and 0.7483 from July and August 2018 are also a support target that if broken, might lead to further downside probing. That area was tested on December 21 and bounced. The rising 100 day MA is at 0.72754. Stay above, keeps the buyers in control.
On the topside, the April 2018 high price reached 0.7813 and would be a key upside target if the buyers can keep the control.

