Range reaches the average over the last 22 trading days
The EURUSD has extended sharply to the downside in the last hour or so (see prior post). The range from my earlier post was around 37 pips for the day. Since then, we have tacked on an additional 53 pips. The range is now 90 pips. The 22 day average (about a month of trading) is 92 pips. So we have reached the bogey (for the most part).
I wrote earlier, the market was looking "for a push". Yields went up a little bit which helped the dollar, but the biggest catalyst might have just been the technicals.
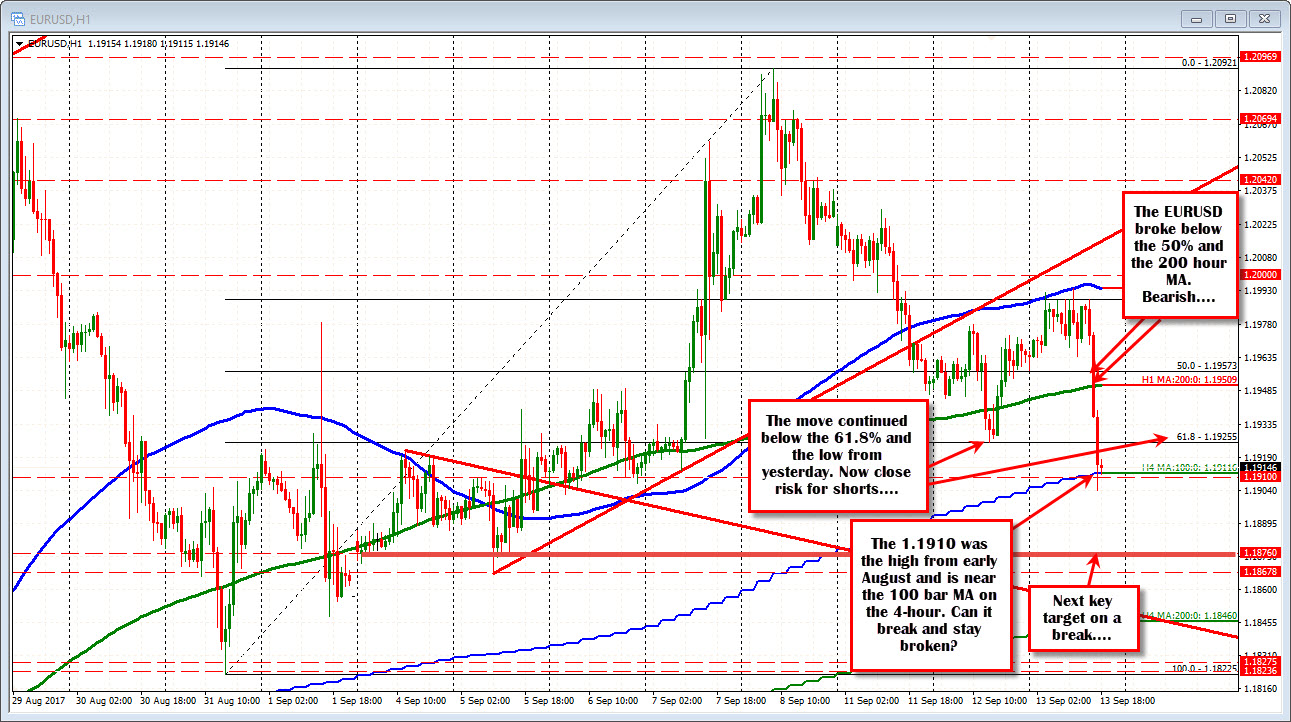
The price action saw the EURUSDs price move below the 50% retracement at 1.19573, then the 200 hour MA at 1.19508.
It then moved below the 1.19255 level. That level was the 61.8% of the move up from the August 31 low AND the low from yesterday.
The move below that level pushed further below the 100 bar MA on the 4-hour chart at 1.19116 (green step line in the chart above). The 1.1910 level is also the swing high from early August (was the high for the year at that time).
The low reached 1.1904 and found some buyers. I can see the 1.1900 natural support, the 1.1910/11 area and the average trading range as a reason to stall the fall.
We currently trade above the 1.1910 level but below the 1.19255 level (61.8% and old low).
Sellers would now want to see the correction stall ahead of the 1.19255 level (that level is now close risk for shorts), but will need that extra push lower to keep the train running to the downside.
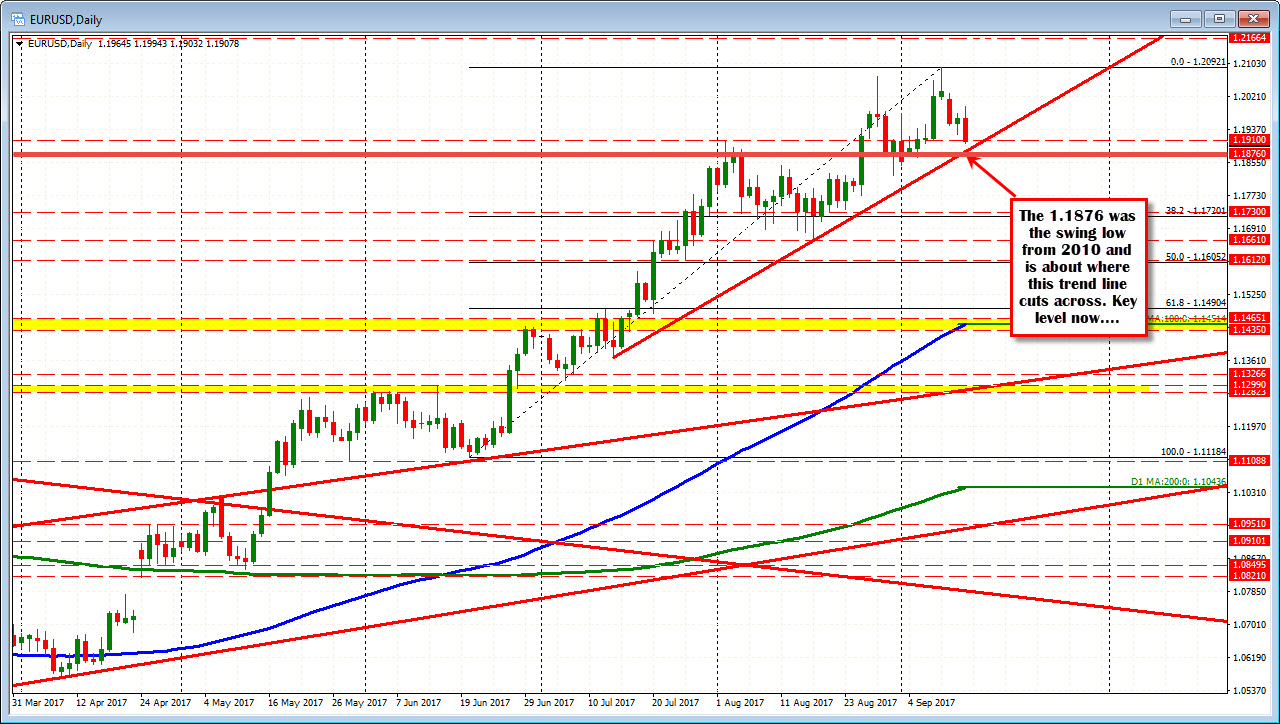
If the trend can continue and the range trade above the what is average, remember the 1.1876 area. That level is the swing low going back to 2010. A trend line on the daily comes in at 1.18789 area (see chart below). So that should put a stall to the fall if tested (but I would expect stops on a break too).
Until the push though, the 1.1900-1.1910 is an area to eye for some profit taking.