Price action on daily chart pushes to swing area and bounces
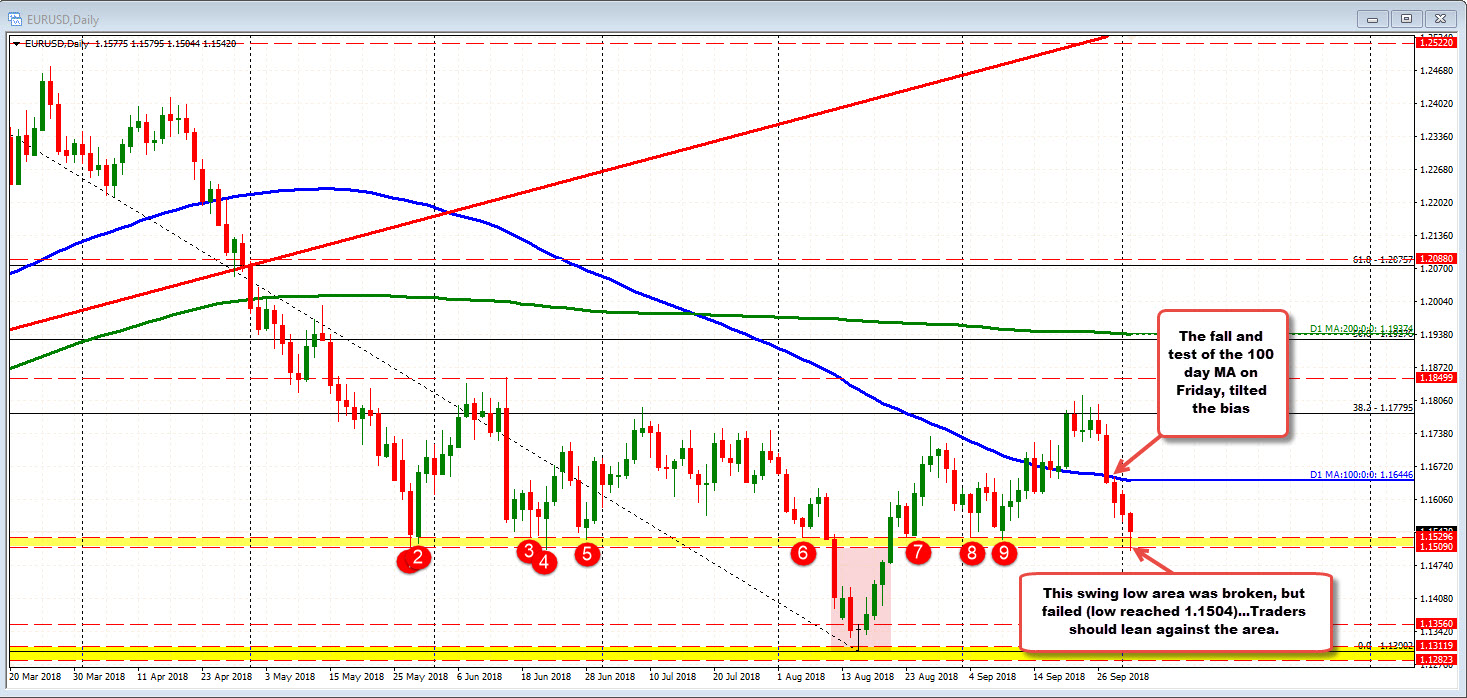
The EURUSD pushed lower in trading today (Italy drag) and in the process moved to test a swing area in the 1.1509-29 area (see yellow area on the daily chart below).

That area has been home to a number of swing levels going back to May. In August, the price cracked below that area for 7 trading days. The price moved back above and retested the area in August and September and the price bounced.
Today was the first stiff test of the level in October (the price actually moved to a low of 1.1504), and sellers had their shot, but buyers entered again. The price has pushed higher.
The price is currently back higher at 1.1538. Traders should look to lean against the area on dips again if the low is in place.
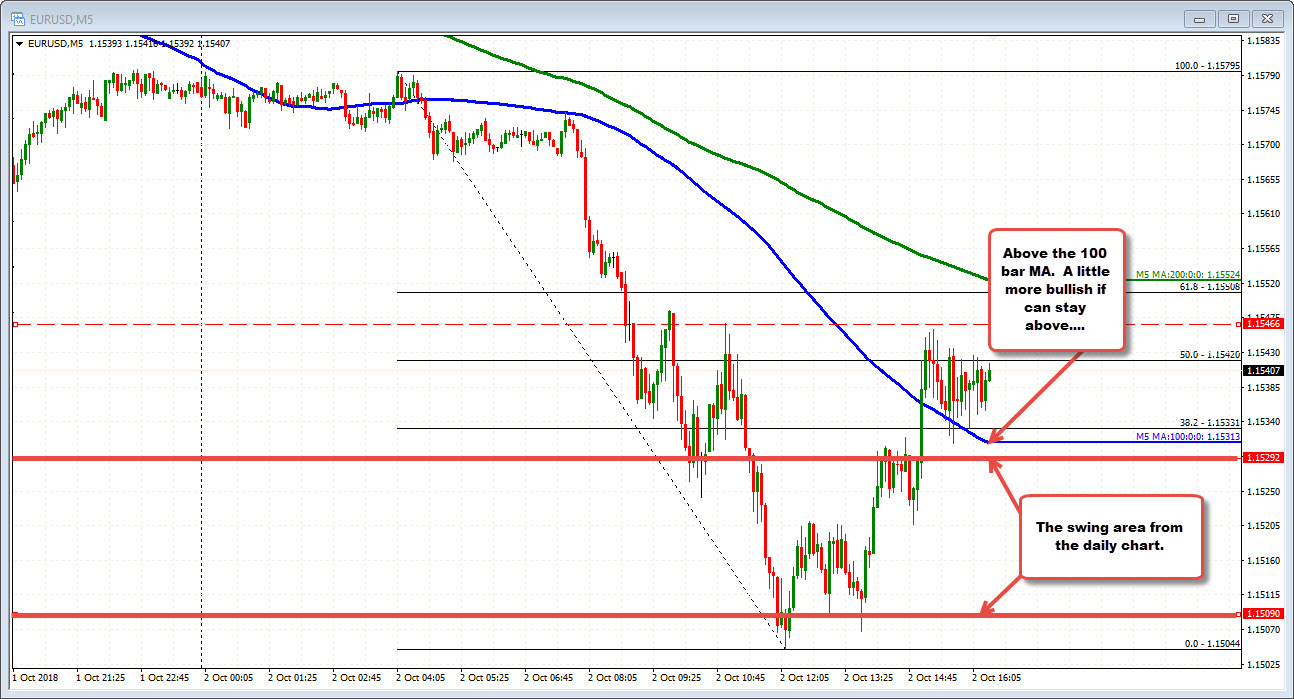
Drilling to the 5-minute chart below, the technicals should give bias clues. Looking at the chart below, the price trended lower in the London session - running away from the 100 bar MA (blue line in the chart below).
The corrective move off the low has moved above that MA line and is trying to hold the line as support now. Stay above will keep the correction move alive. Move back below, and then the 1.1529 level (back into the swing area on the daily), and the market bias is more muddy with a test of 1.1509, not out of the question.


