
100 day MA and swing high and swing low
The EURGBP has had a bumpy and wild ride of it over the last 8 or so weeks. In the current week, the price chopped higher and in the process moved above the swing high from Nov 2 and the 100 day MA (blue overlay line on the 4-hour chart below at 0.89478 currently).
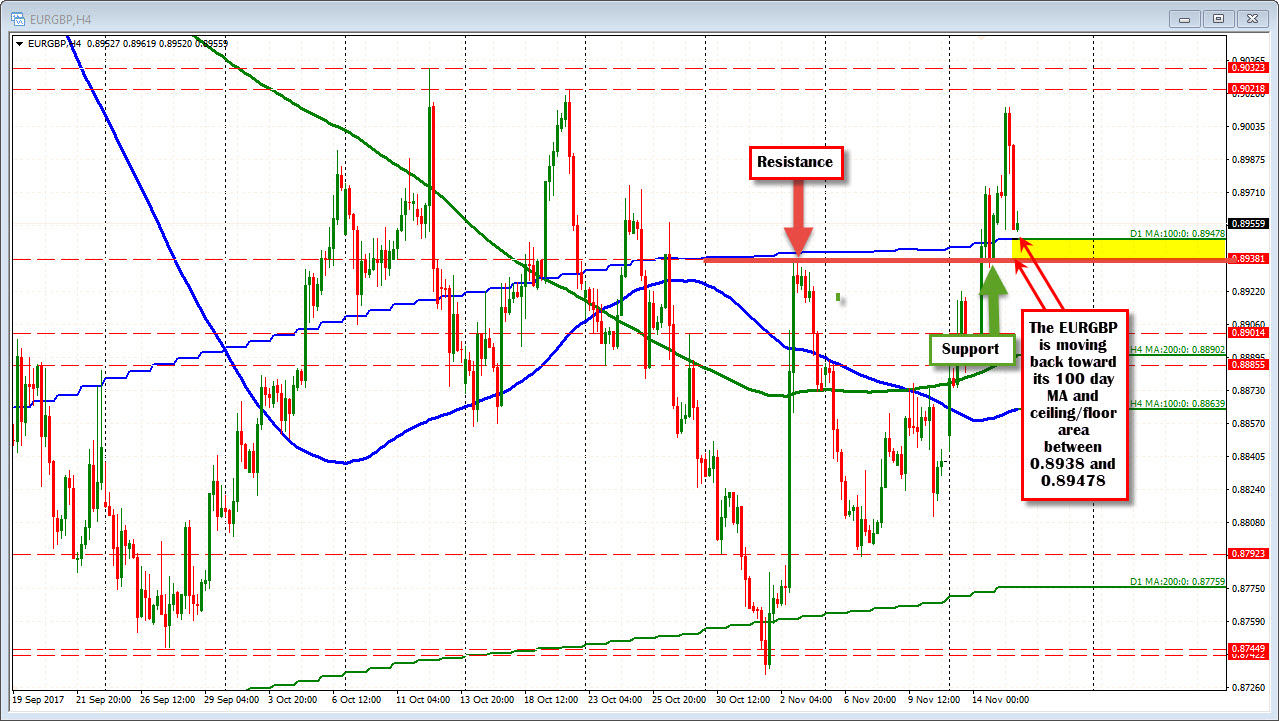
That move took the price up toward other swing highs from October but the run higher ran out of steam. The subsequent fall has taken the price back toward the 100 day MA (at 0.89478), and the old swing high/swing low (at 0.8938).
If the buyers are looking to make a play outside this up and down area, that yellow area in the chart should hold, the price should reverse and we should see October highs taken out.
If thinking is the EURGBP has run it's course, the yellow area will be busted and the move higher can be retraced back down.
So getting to decision time. Look for buyers to lean in the yellow area. If it breaks, get out.

