
Back above the 100 day MA (what's new).
The GBPUSD over the last 9 trading days has traded above and below its 100 day MA on 7 of those days. (blue numbered circles show the days (today included). Typically, the price moves away from the key MA level, not hang around it.
Needless to say, in the current choppy environment for the GBPUSD, there is moves away but the price returns back to the MA level and goes the other way.
What does that say? It says to me that the market is unsure of the next move. We have to deal with it. The market does not know which way it wants to go.
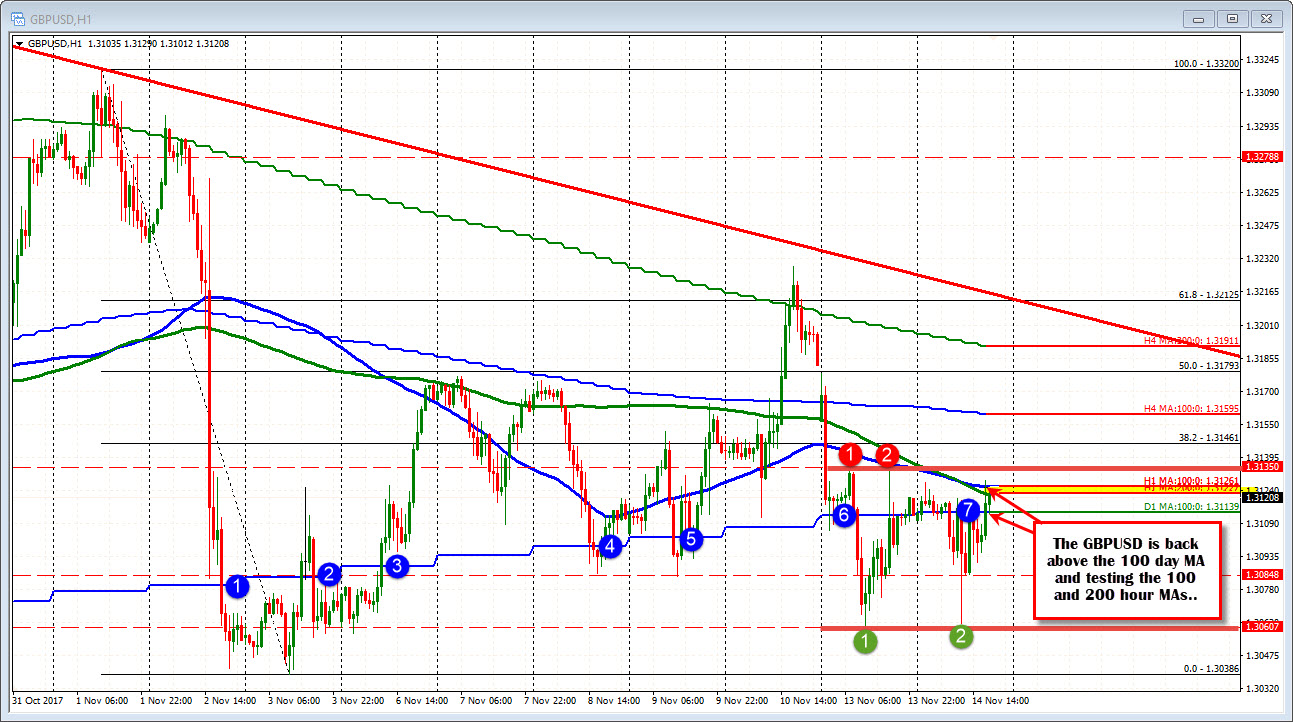
Today, the price traded above the 100 day MA earlier in the day. It spent most of the London session below it. In the last few hours,, we have moved back above it at 1.31139.
More bullish? Well.....
The problem is the 100 and 200 hour MAs (blue and green lines at 1.3222-263) are being tested and causing a stall. Also the 1.3135 formed a double top in yesterday's trading (see red circles). So there is a stall ahead of that level too (it is a target to get through).
Do longs need to sell? Not necessarily. Those levels can be broken and a run toward the 38.2% at 1.3146 or the 100 bar MA on the 4-hour chart at 1.31595 (that is a key level - it was tested a number of times last week). However, the ups and downs may also lead to sellers back below the 100 day MA. In which case, you lose.
That is the risk, and the market may even continue to chop should you get out.
When the market chops, all traders have to deal with it (or not deal with it if you choose to not trade the pair). I still would rather pick technical spots (if trading ) and risk a little with the hope for a run. However, eyes should always be open for momentum to fade, for breaks to fail and if so, take a small hit and look for the next trade.

