
200 hour moving average and trendline defines the downside barometer for buyers and sellers
The GBPUSD *the day above its 100 hour moving average after a late day rally yesterday (blue line in the chart below). However after a few hours of trading, the price moved back below that level and stay below that level marching to the downside.
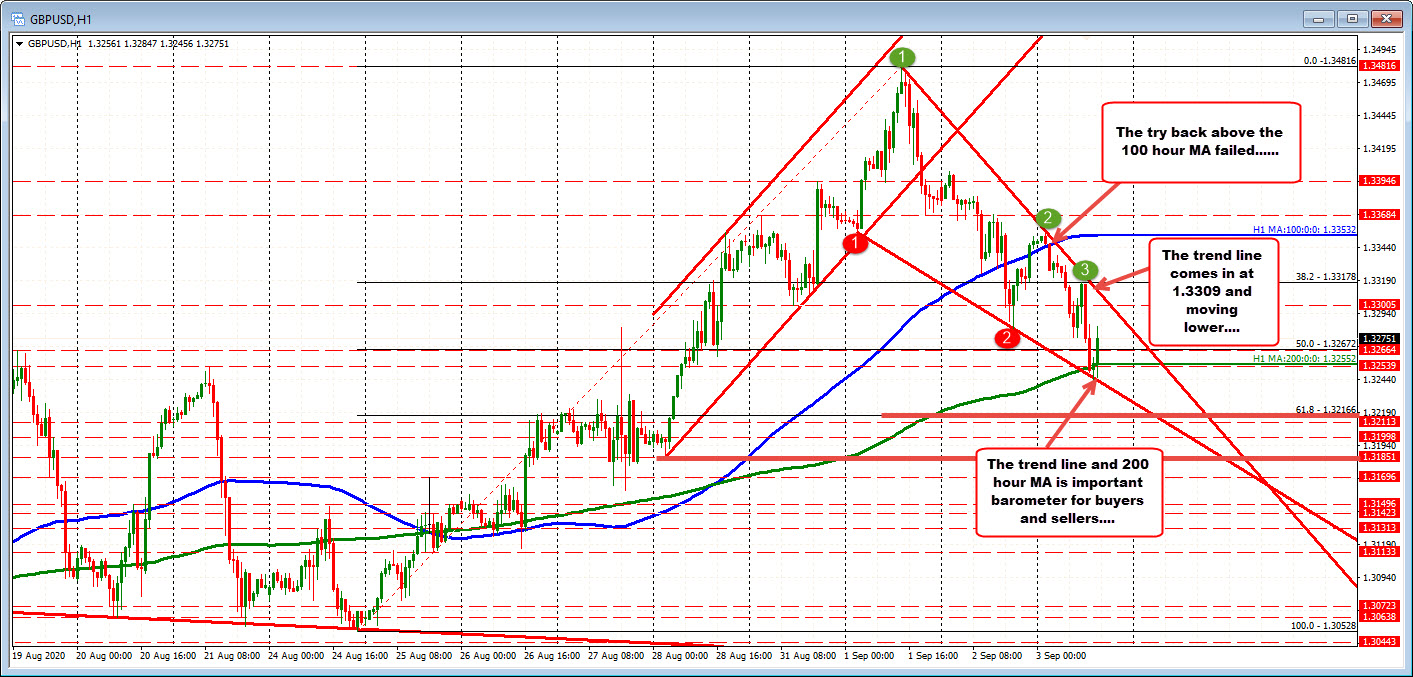
The 1st break was through the 38.2% retracement 1.33178. That level was retested on a corrective move higher in the London morning session. Staying below kept the bears in control.
The 2nd and 3rd and 4th major targets included the
- 50% retracement of the move up from the August 24 low at 1.32672,
- the 200 hour moving average at 1.32552, and
- a lower trendline connecting recent lows on the hourly chart. That line currently comes in at 1.32423 (and moving lower).
The low price for the day stalled against that lower trendline. The levels now become barometers for bulls and bears. In particular, keep an eye on the 200 hour moving average (green line) and the lower trend line.
If buyers are to make their play on a bottom, those levels should hold. If they cannot hold support, I would expect dip buyers to turn to sellers and for a move back down toward the 61.8% retracement at 1.32166 as the next target.
On the topside, the downward sloping trendline comes in at 1.3309 (and moving lower). Just ahead of that is the 1.3300 level. Recall from Monday the price stalled against that natural support level. Not expect some stall on a test with stops on moved above those levels.

