The pair is trading in a 53 pip trading range today (22 day average is 90 pips).
The GBPUSD is mired in a narrow up and down trading range today. The range is only 53 pips. That is light compared to the 90 pip average over the last 90 trading days).
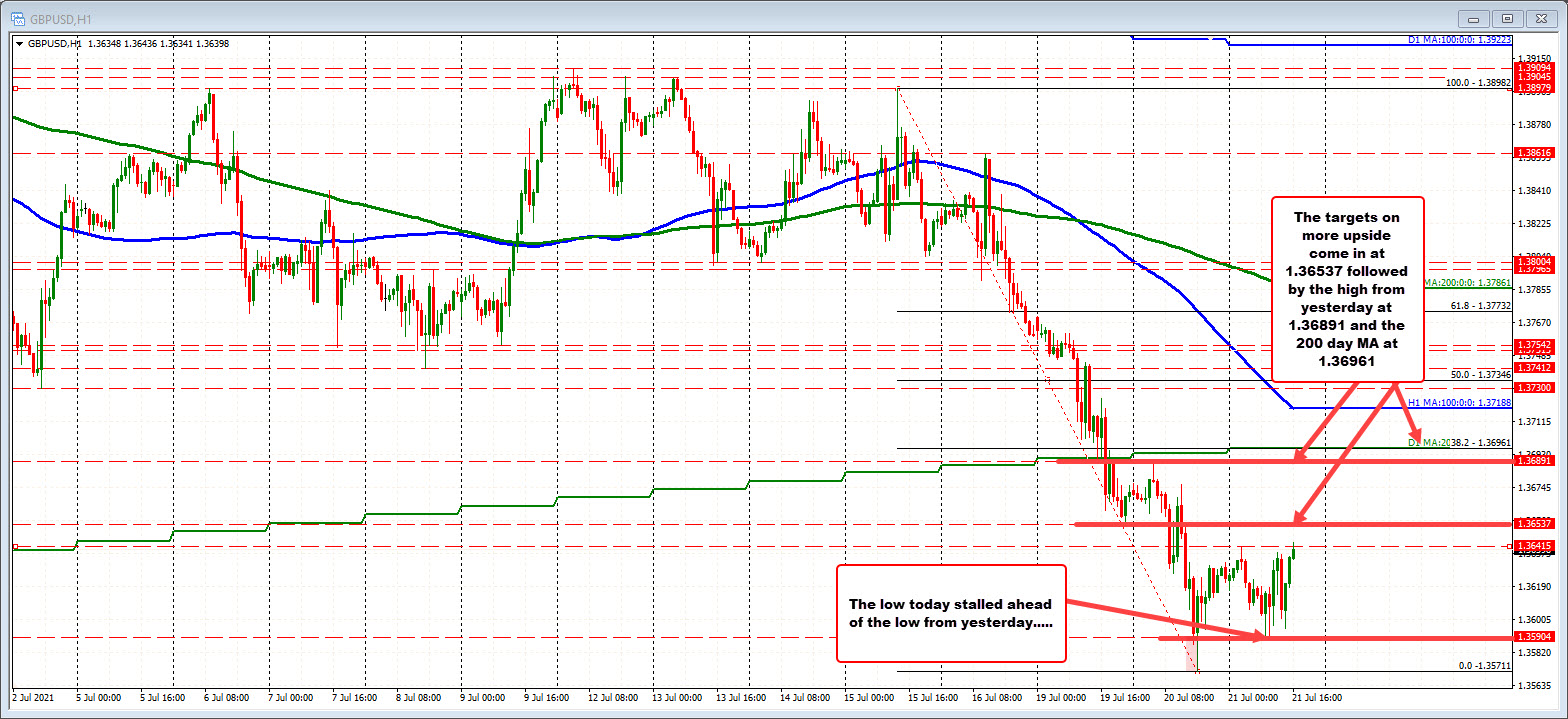
The low today stalled ahead of the low from yesterday (Low today 1.35904. Low from yesterday was at 1.35711). The high stalled at 1.3643 so far. And That high was somewhat random. It was comfortably below the low from Monday at 1.36537.
The 1.36537 level would be a target on more upside corrective price action today. If that level can be broken, we could see more upside probing toward the high from yesterday at 1.36891 along with the key 200 day MA at 1.36961.
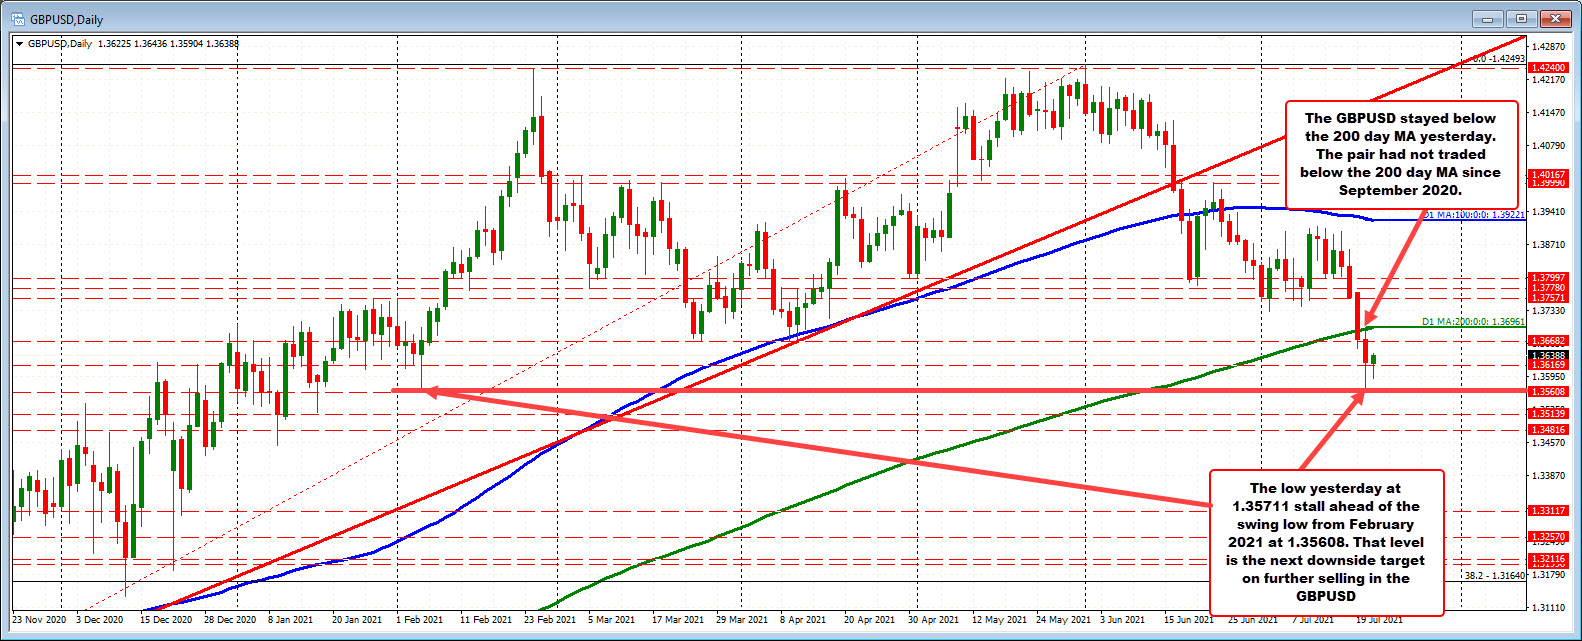
Recall from Monday (see daily chart below), the price fell below the 200 day moving average for the first time since September 2020, and stayed below that moving average all day yesterday (it got within 4 or so pips before finding sellers).
The 200 day moving average remains a key barometer for the buyers and sellers on a longer term basis. If the price can stay below, the bears have more control. If the price moves above, the sellers on the break of the 200 day MA would certainly be disappointed (and will likely cover shorts).
Looking at the daily chart below, the low price from yesterday came in at 1.3571. That was short of the February 2021 low at 1.35608. If the sellers push lower (and stay below the 200 day moving average), the February low will be the next major target, followed by a mid-January swing low at 1.35139 (see chart below).