
Prices back above its 100 hour moving average
Last week, the GBPUSD it trended to the downside. The price fell 4 of the five days (with a modest price on Wednesday). The move to the downside traded down to just above the 1.3600 level at 1.36016 on Friday.
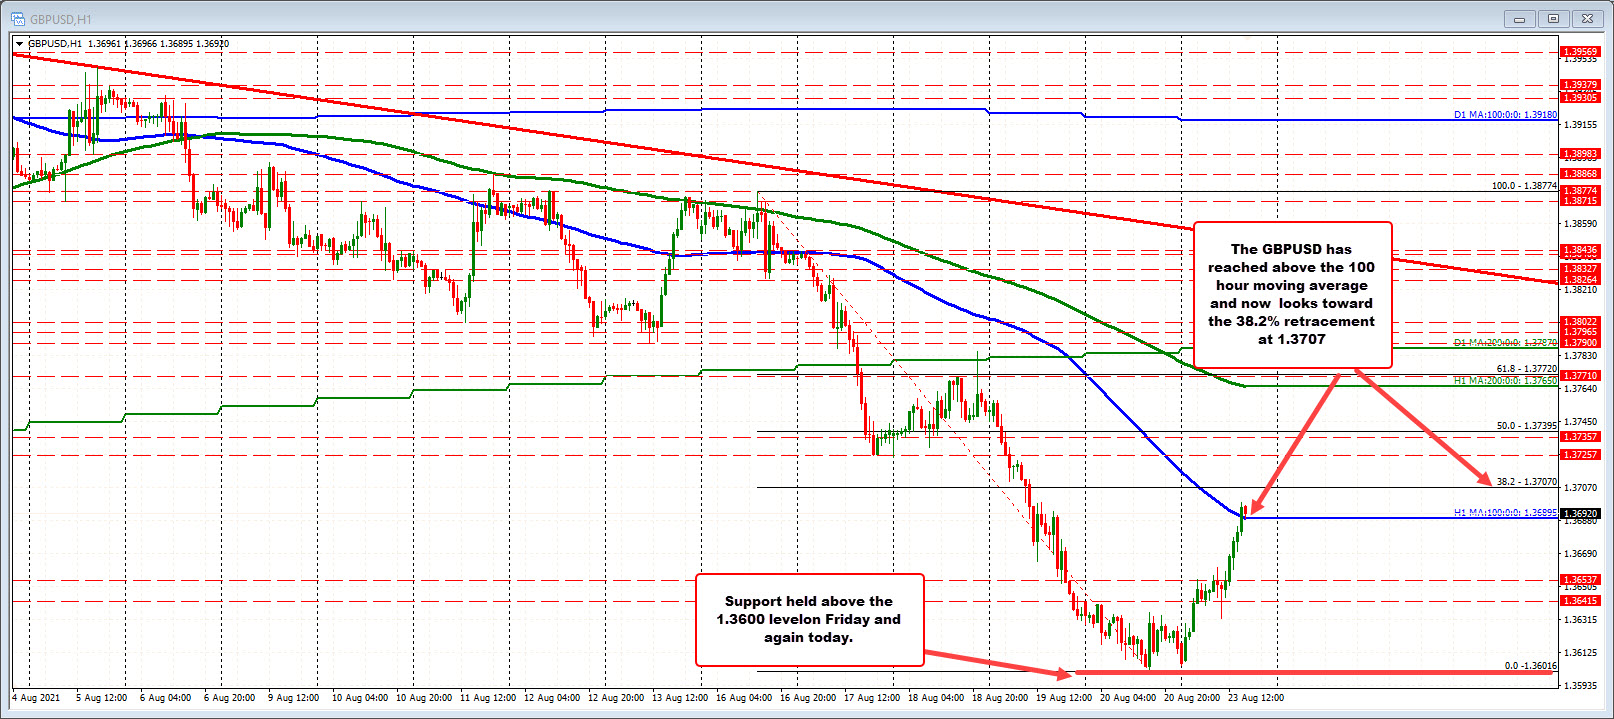
In the early Asian session, the price retested the Friday low but found buyers and started to push higher helped by dollars selling/a more favorable risk on flow. The move to the upside has now seen the price extend back above its 100 hour moving average for the first time since last Monday. That moving average currently comes in at 1.3695. The high price just reached 1.36988.
Staying above the 100 moving average in the short term would be the best case scenario for the buyers,
Drilling to the 5 minute chart below, there was a number of swing levels between 1.36289 1.36359 over the last couple of trading days (see red numbered circles and lower yellow area). THe price moved above that area in the Asian session, and later retraced into the area, testing its 200 bar moving average at the same time (green line). Holding support there, has led to a trend move higher and ultimately a move above its 100 hour moving average at 1.36895.
The price is trying to stay above that level 100 hour moving average. Stay above is more bullish. Move below, and we could see a rotation back down toward the 38.2% retracement 1.3673 as the momentum higher takes a breather.


