Bounce is off the 50% retracement of the years trading range
The price of gold fell to the lowest level since early July in trading yesterday. The low price extended to $1764.80. That was just above the 50% midpoint of the 2020 trading range. That level comes in at $1763.51.

Today, the price continued the corrective move to the upside after holding that key support level. The price also move back above its 200 day moving average (green line in the chart above) at $1801.32. The high price has moved to $1817.37. The current price trades just off that high level at $1814.30. That's up $37.35 or 2.10%.
The 200 day moving average now becomes support. Stay above could be some more building back to the upside after the decline seen since peeking in early August at $2075.47.
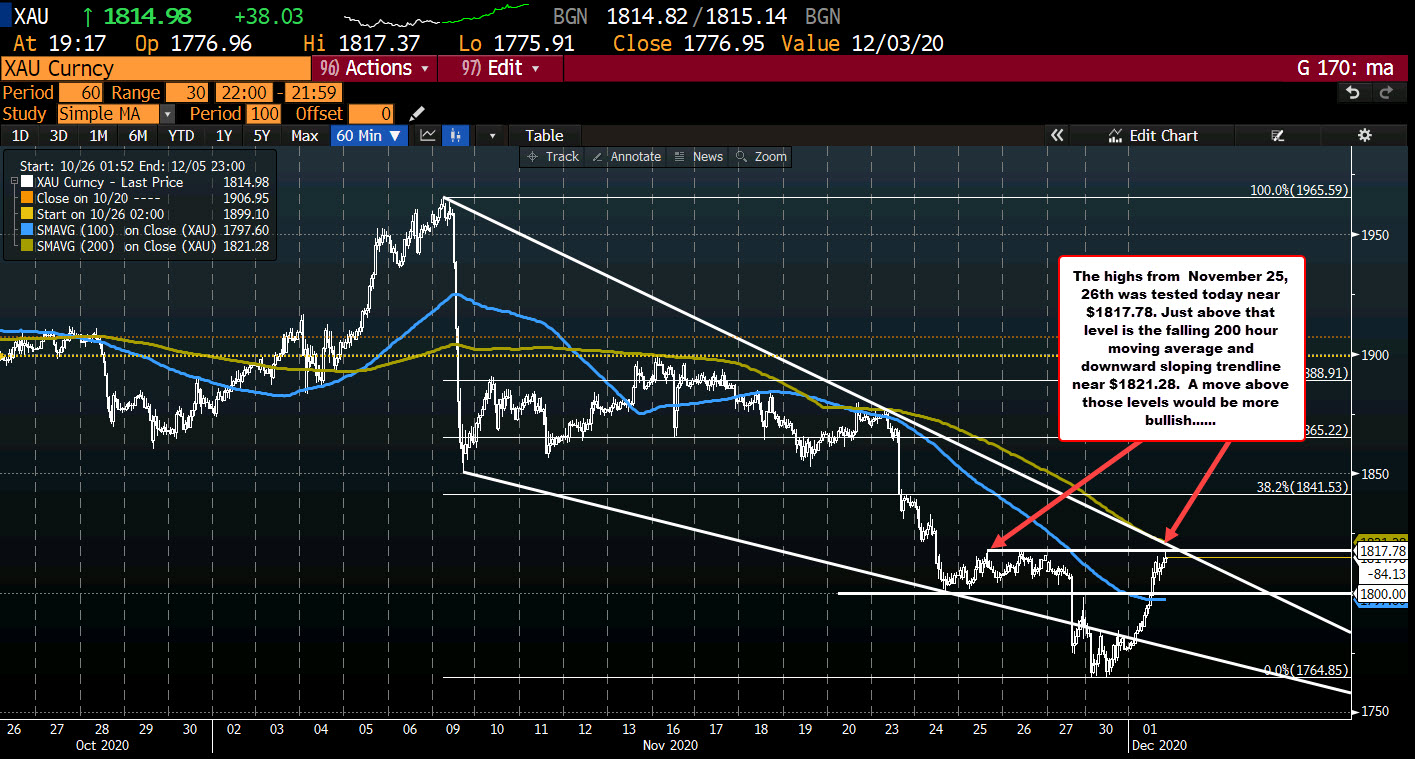
Drilling down to the hourly chart, the move to the upside, tested the high prices from last week up near $1817.78. Also just ahead is the falling 200 hour moving average. That level comes in at $1821.27 and moving lower. A downward sloping trendline also is near that 200 day moving average.
So there is some pretty decent resistance starting at $1817.78 and extending up to $1821.28. It would take a move above that area to solicit more buying with the 38.2% retracement of the move down from the November high at $1841.53 as the next key upside target.