The rise in gold has stalled since the peak at $1689.31 yesterday
Up until yesterday afternoon in the NY session, gold was going higher and higher as the coronavirus situation worsened. However, after reaching a high at $1689.31, the price started to rotate lower helped by an apparent large seller in the futures market.

Today, despite the continued wobbly stock market, the price of gold has remained lower on the day. We currently trade down about -$10 on the day at $1648.
Technically, the run to the upside on the daily chart above, took the price above a topside trend line currently at $1625. If the price is to tilt more to the downside, the price will have to get below that broken trend line and remain below the level. Stay above and it hard to call the sellers firmly in control (if fact the buyers are leading the way from that perspective).
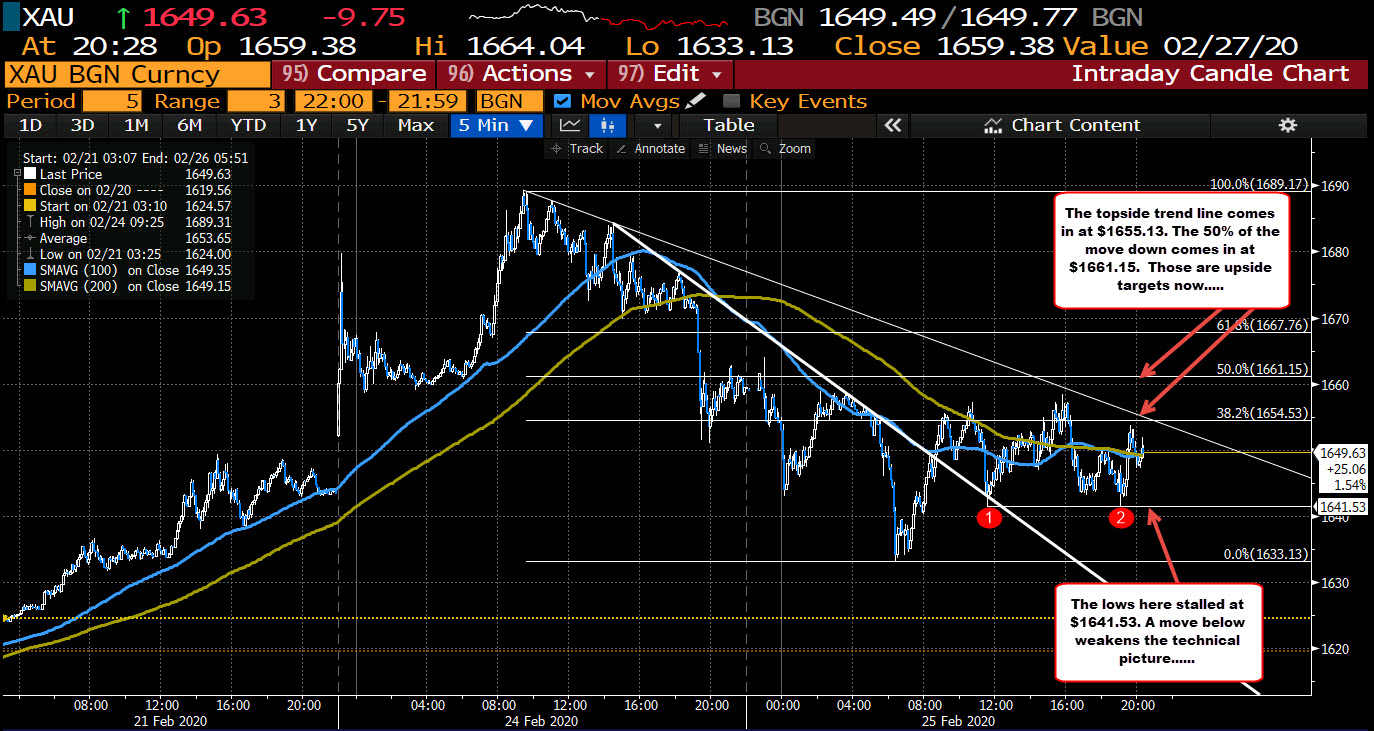
Drilling to the 5 minute chart below, the run lower yesterday was helped by the break of the 100 and 200 bar MAs (blue and green lines). The up and down price action today has allowed the 100 and 200 bar MAs to catch up and converge at $1649.35 area. We currently trade near that level now.
The market price action (and technicals from that chart) are showing a "market" that is not sure about the directional bias from this area. At some point there will be a run back higher or lower.
If the move is back to the downside, the $1641.53 level was home to two swing lows today. Get below, will have traders looking for a retest of the $1633 low and then the $1625 brokne trend line from the daily chart above.
On the topside, watch the topside trend line at $1655.13. The 50% retracement of the move down from the high yesterday, comes in at $1661.15. Get above those two levels, and we should see the upside reignited.