Hop on trend train in the "correction zone"
A real-life example of technical trading:
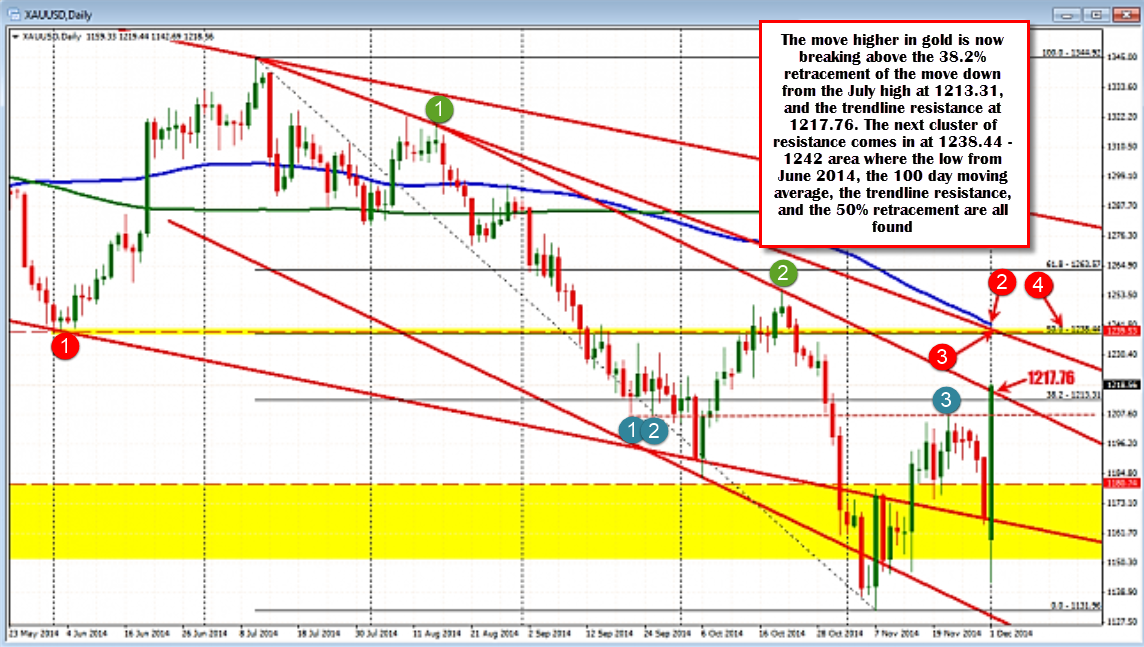
Gold is continuing the squeeze higher as traders are forced to cover shorts after the results of the Swiss Referendum failed to lead to lower prices. The move higher has now taken the price above the 38.2% of the move down from the July 2014 high at the 1213.31, and the topside trend line at the 1217.76 (see chart below).

Gold surges higher and moves above trend line resistance.
If the momentum is to continue, I would expect that there should now be support at the 1207.60 to 1213.31 area (see chart above). While, a further move higher on the daily chart, will next target a cluster of resistance in the 1238.44 – 1242.00 price area. This area corresponds with:
- Lows from June 2014 (at 1240),
- The 50% retracement of the move down from the July 2014 high (at 1238.44),
- Trend line resistance at 1241), and the
- 100 day moving average (blue line in the chart above at 1242 currently)

If the trend higher is to continued, I would expect patient buyers in the 1206.59-1210.01 area now.
TRADING TIP: The surge higher in Gold is what we used to call in the old days a “moon mission”. When you have a huge bar, like the one on the daily chart above, corrections of that move can be quite painful. For example, a 38.2% of the full range higher today is $30. I don’t want to risk $30 on a trade.
As a result, for me, if I can’t get in on a dip against a support and risk defining level, I would be just as happy doing nothing. That is, I will not want to buy a new high (nor buy too high). The risk is just too great.
So where might be a support level that traders can lean against? A level where they can hop on the trend train without risking too much?
On the daily chart, I outlined the 1207.60 to 1213.31 area as a support area. Traders can lean against that level and use it as an entry and risk defining level. as well.
Are there other supporting levels from other charts that might give a clue as to where a supported dip might be found.
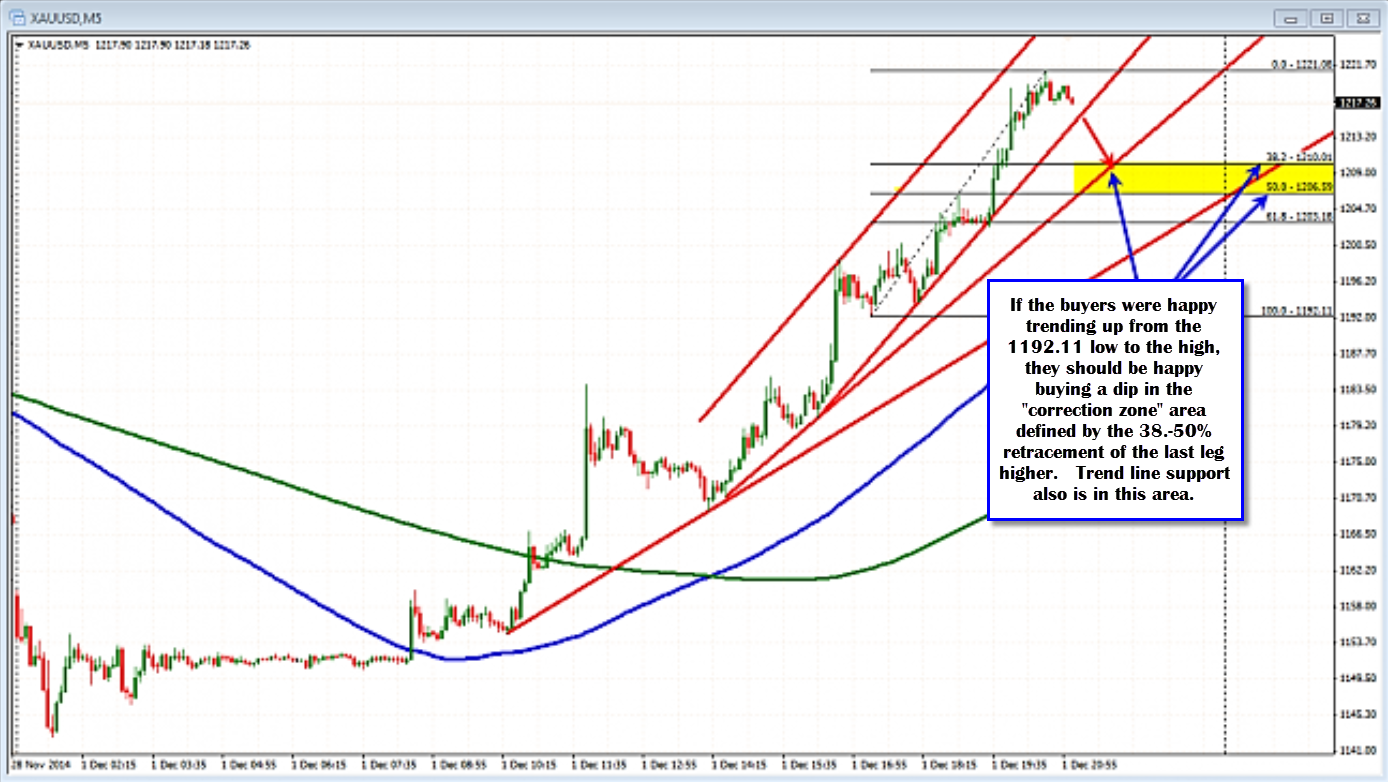
Looking at the 5 minute chart below, the price has been trending higher with little in the way of a correction. The last consolidation low started at 1192.11.
Putting a Fibonacci retracement from that low to the current high, has the 1206.59 as the 50% retracement and 1210.01 as the 38.2% retracement. This area between those two retracement levels I call the “Correction Zone”.
The idea is if the buyers were happy trending the market from that intermediate/consolidating low to the high at 1221.08, they should be happy buying the dip of that move in the “Correction Zone.” (i.e, the yellow area in the 5 minute chart above).
This would be my area to look to "hop on the trend train".
Note also that the 50% level at 1206.59 is near the 1207.60 area from the daily chart. As a result, there are a few reasons to expect buyers to show up.
What if the price ends up going below the “Correction Zone”?
If the price goes below, that Correction Zone, I would look to get out.
The purpose of the trade is to get in on a trend by hopping on after the fact. By buying a dip, you are NOT hopping on at a new extreme level. I find that fear is high when buying (or selling if the price is going lower) a new price extreme.
If the price cannot hold the 50% of the last trend move higher, I suspect that the trend is likely over or at the least, there is the potential for more correction/more consolidation.
What about selling? Can traders try and pick a top? That is if the price moves below the trend line on the 5 minute chart, or if the price moves below the 50% retracement - might those breaks be sell opportunities?
It may be. It may not be too.
My rule in a trend market (which this is) is if you want to pick a top by selling on a break of a trend line for instance, make sure, that if the expected counter trend momentum does not materialize,and the price moves back above the reasons to trade (i.e. a break of the trend line or the 50%), then get out.
Trends are fast, directional and can go longer than you think. So I would rather be cautious and take a small loss, versus getting caught in a further continuation of the trend.


