
Euro chart via GS, one for the Elliot Wave folks, the bank says the range is pretty well-defined:
EURUSD has spent the majority of (last) week tracking below a trendline off the highs from Apr. '18 at 1.1412
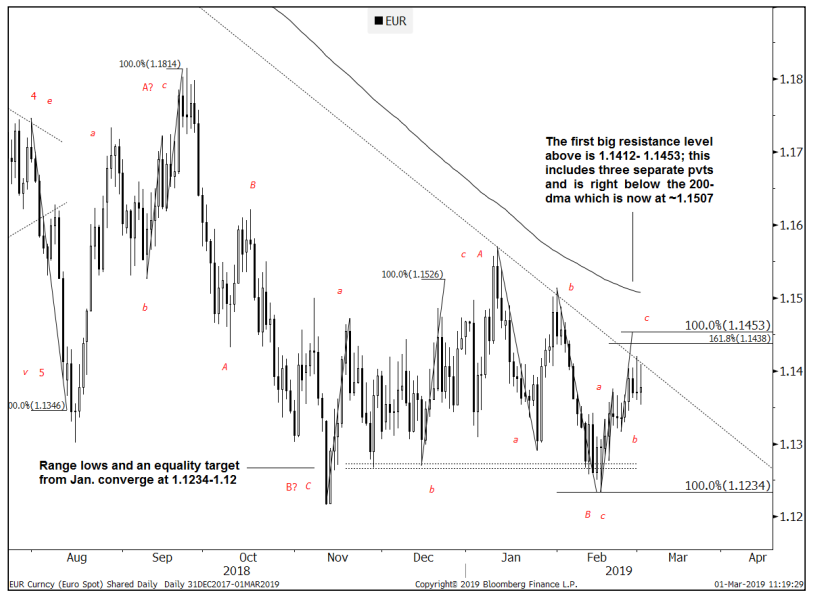
- The area between 1.1412 and 1.1453 encompasses multiple pivots; namely the Apr. '18 downtrend and an ABC off the lows. Given the corrective nature of price action since November, this is just another place from which the market could reverse back into its range. Moreover the 200-dma is right above there at 1.1507; which hasn't been breached since late-April/early-May '18. Would have to see a break higher than there to really see traction above. As for support, range lows stand down at 1.1290-1.1234.
- View: Up against range resistance 1.1412-1.1453; with support all the way down at 1.1290-1.1234. Need above 1.1507 to consider the possibility of a more meaningful advance.

