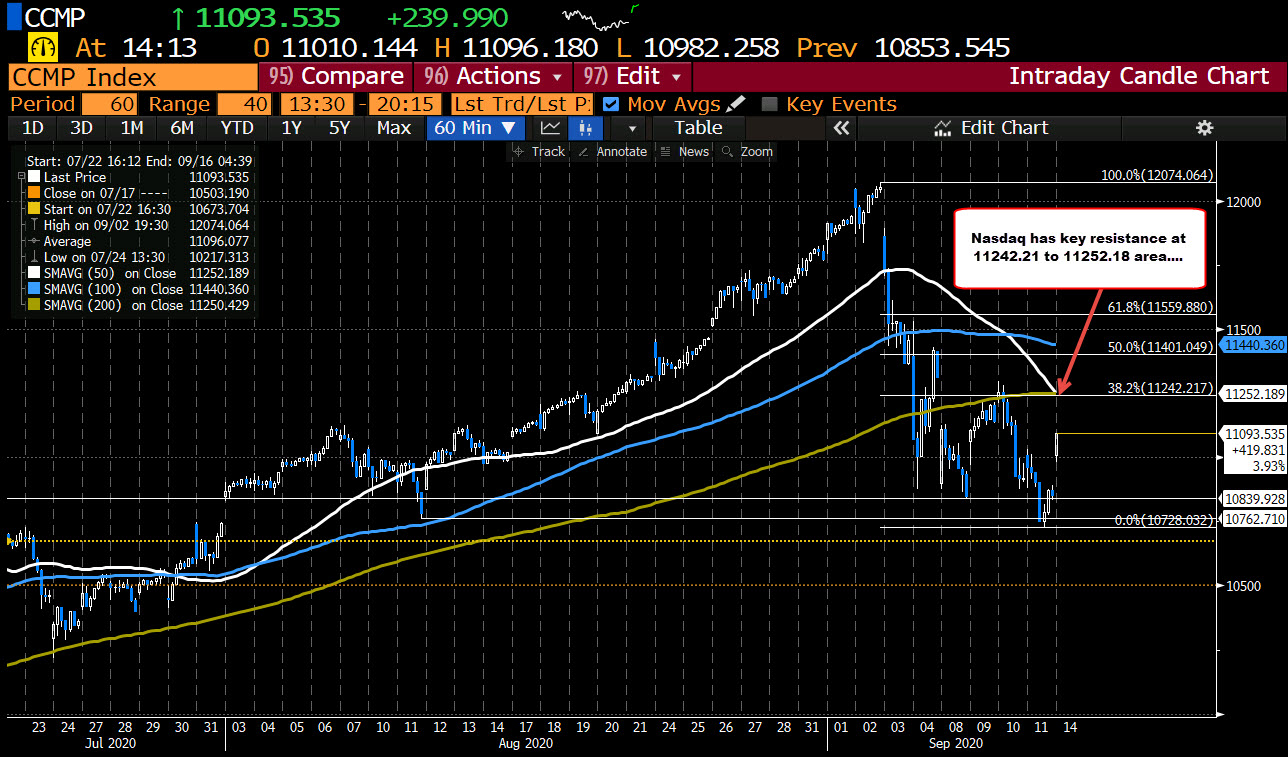
The index key has key resistance at 11242 to 11252 area.
The NASDAQ index is leading the way to the upside in the equity markets today. It currently trades up 236 points or 2.18% at 11090. The high price extended to 11096.93.
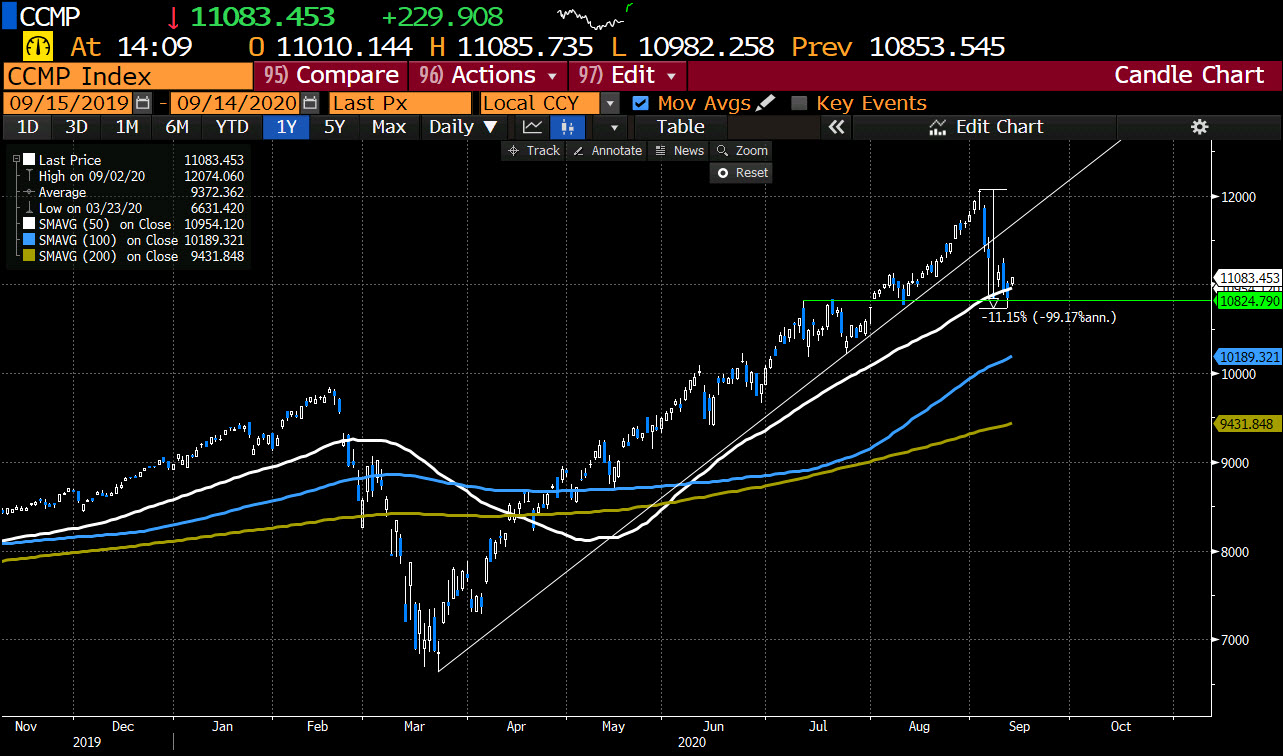
The moved to the upside today has taken the price back above its 50 day moving average at 10954.12 (see white line in the chart above). The price decline from the all-time high of 12074.06 saw the price come down -11.15% (from the high to the low).
Is that correction enough?
What will help to determine the answer the question may come from the hourly chart below.
Looking at it,
- The 38.2% retracement of the move down from the high price comes in at 11242.217.
- The 200 hour moving average comes in at 11250.438.
- Finally the falling 50 hour moving average comes in at 11252.260.
The combination of those 3 technical levels will go a long way toward defining a more bullish technical bias (on a move above), or a more bearish technical bias (if the price cannot extend above those levels).
With the current price still below those levels, but moving higher today, the verdict is still out from a intermediate/longer term prospective on whether the correction was enough. However keep those levels in mind going forward should the momentum higher continue today. The market certainly will be watching the area for technical clues.