
100 and 200 hour MA are converged
The EURJPY has been mired in a range of about 100 pips (104 actually) since breaking higher on December 1. That is a narrow trading range. The "market" is saying "I don't know what is next, but am waiting for the next shove".
Non-trending transitions to trending. The market is non-trending.

So while the market chops up and down, there is hope in anticipating a break and run at some point (i.e. that next shove).
Looking at the hourly chart, the 100 and 200 hour MA cuts across the middle of the high and low range. That is expected as the market non-trends. Those MAs have seen a lot of moves above and below of late which is also expected. Traders waffle back and forth.
Having said that, the MAs can act as bias defining clues for the bulls and bears. Move above and stay above is more bullish. Move below and stay below is more bearish. The next targets become the swing highs to the upside (between 126.648 and 127.739) and the swing lows to the downside (between 125.70-125.782).
Break the extremes, and look for a run.
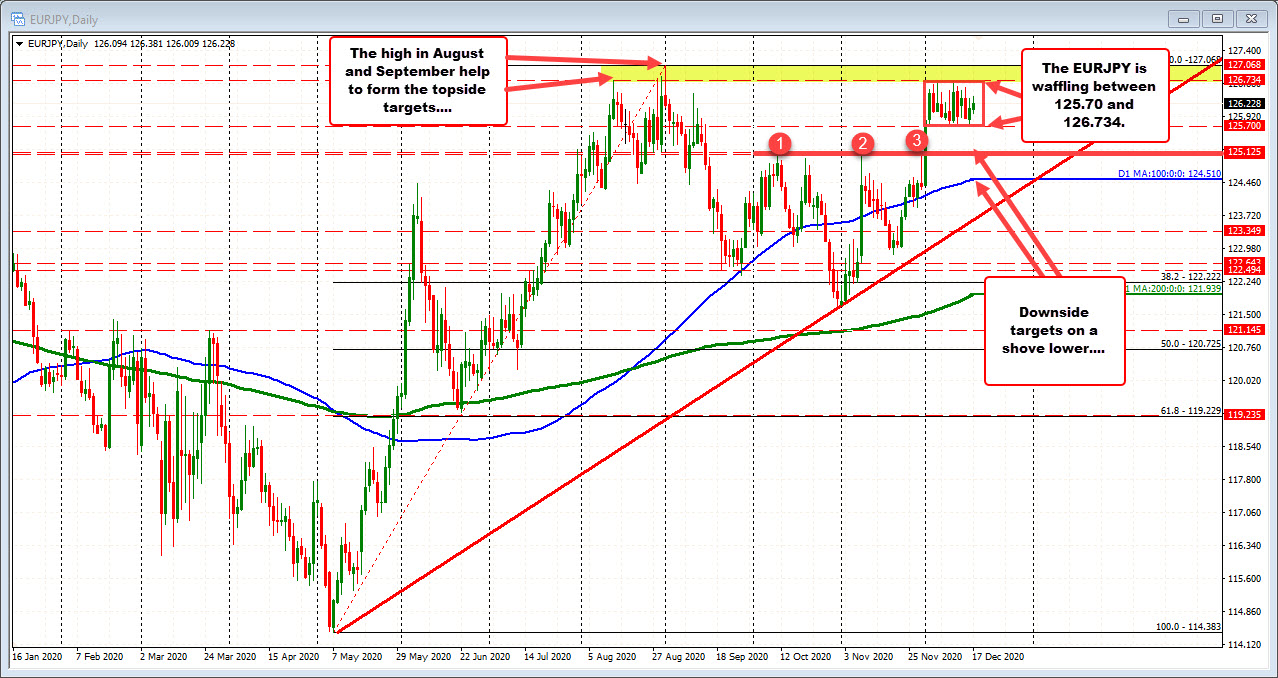
What does the consolidation in December look like on the daily chart?
Looking at the daily chart below, the sideways action is near the highs for the year. Back in August, the high price came in at 1.26745. That is just above the December high price at 1.26734. The high price for the year spiked up to 1.27068 back on September 1. A move higher and above the 126.74 level would need to get above the high for the year and then it would be open road.
On the downside, swing highs going back to October and November stalled near 125.125. So get below 125.70 and traders will target 125.125 and then the rising 100 day moving average at 124.510.
Non-trend transitions to trend. It is a time to anticipate for a break and run at some point. Look for clues. Be prepared.

