It will take a move below the rising 100 hour MA to tilt the bias lower
The GBPUSD is doing it's own chop in trading today. What we know technically, is the run to the high for the day, found sellers near the "drop-ceiling" between 1.33795 and 1.33842. That was ahead of the high from Monday at 1.33969. If the price is to go higher, getting and staying above each of those levels is needed.

What we also know is the chop move back to the downside on the hourly chart, stalled near the 100 hour MA. Recall from yesterday, the pair also found support buyers near the 100 hour MA line. The current MA line comes in at 1.33118 (and moving higher). It will take a move below it and the swing lows for the week, to increase the bearish bias for the pair.
For now the price action is choppy near recent highs with a tilt more to the upside - at least above the 100 hour MA.
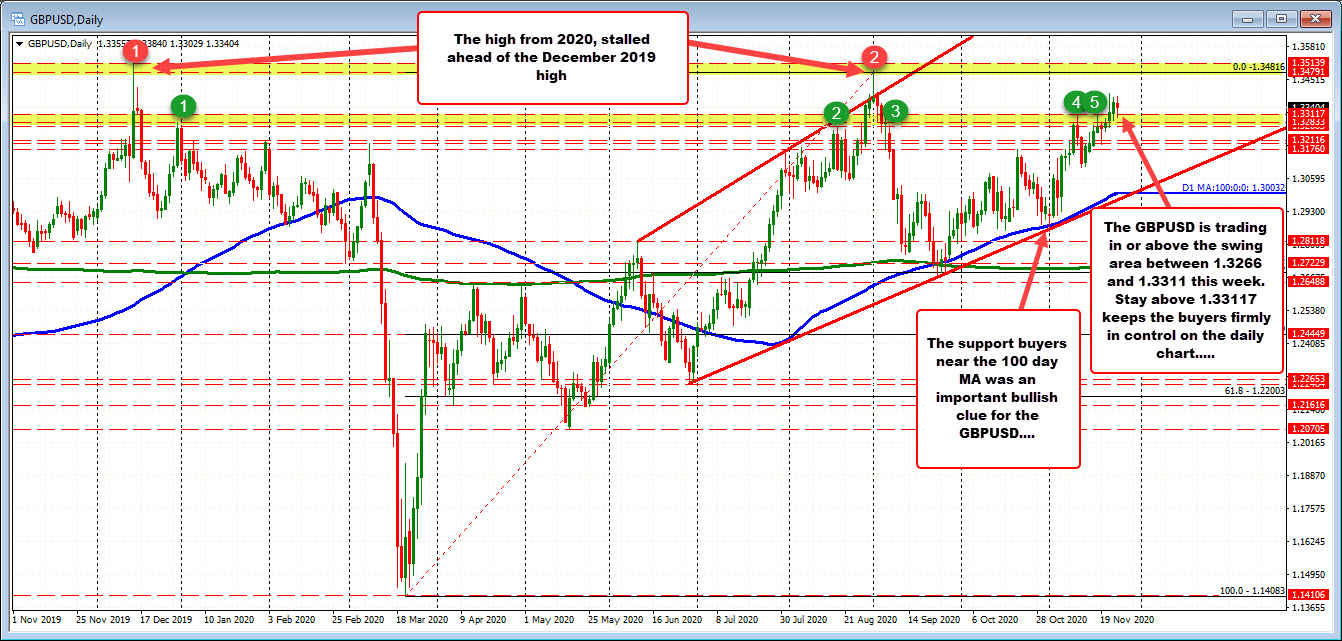
Taking a broader look at the daily chart, what sticks out is this week the price has for the most part been able to stay within or above the swing area between 1.3266 and 1.3311 (the low on Monday reach 1.33635 before quickly rebounding). That tilt the bias more to the upside above that area (see green numbered circles and yellow area). On the topside, the high price from 2020 reached 1.34816 on September 1. That level and the high price from December 2020 at 1.3513 are topside target on further upside momentum.