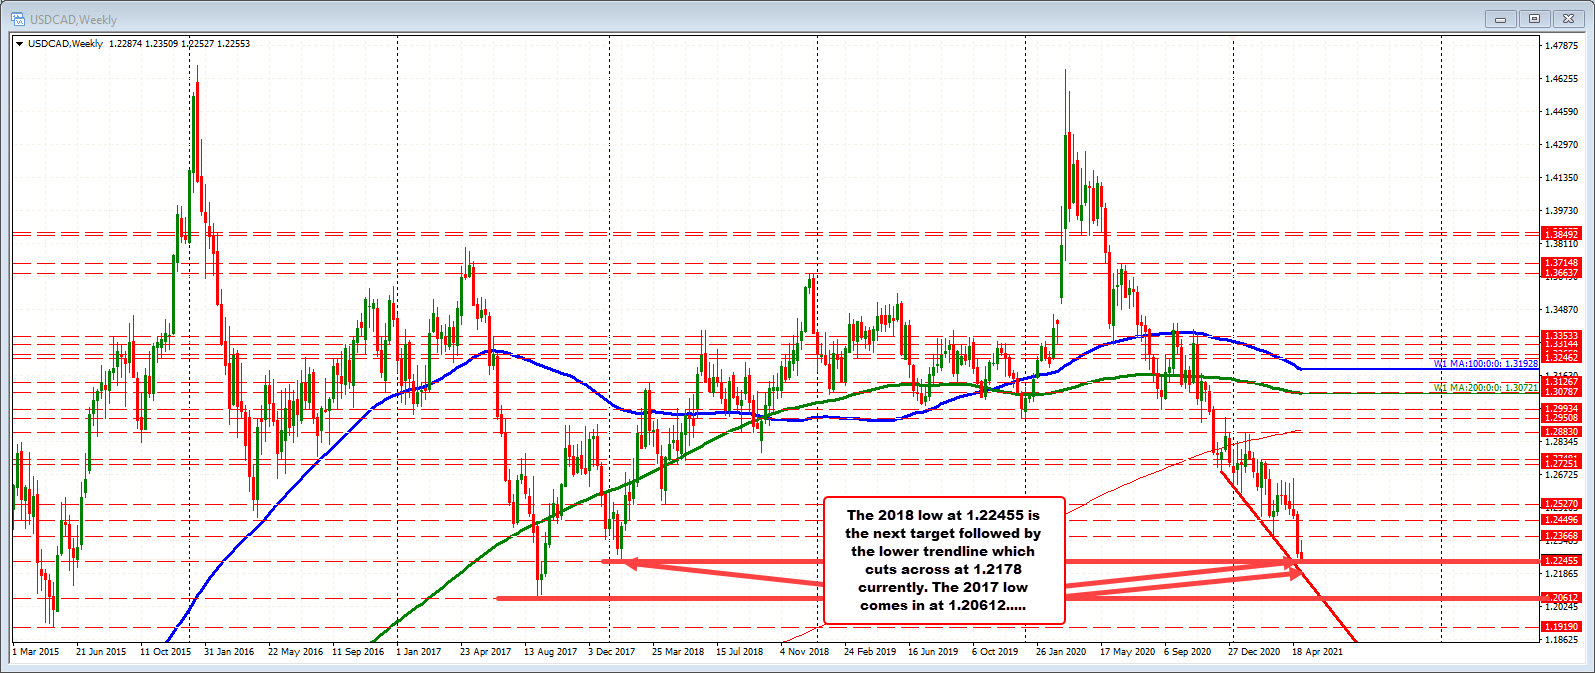
2018 low is at 1.22455
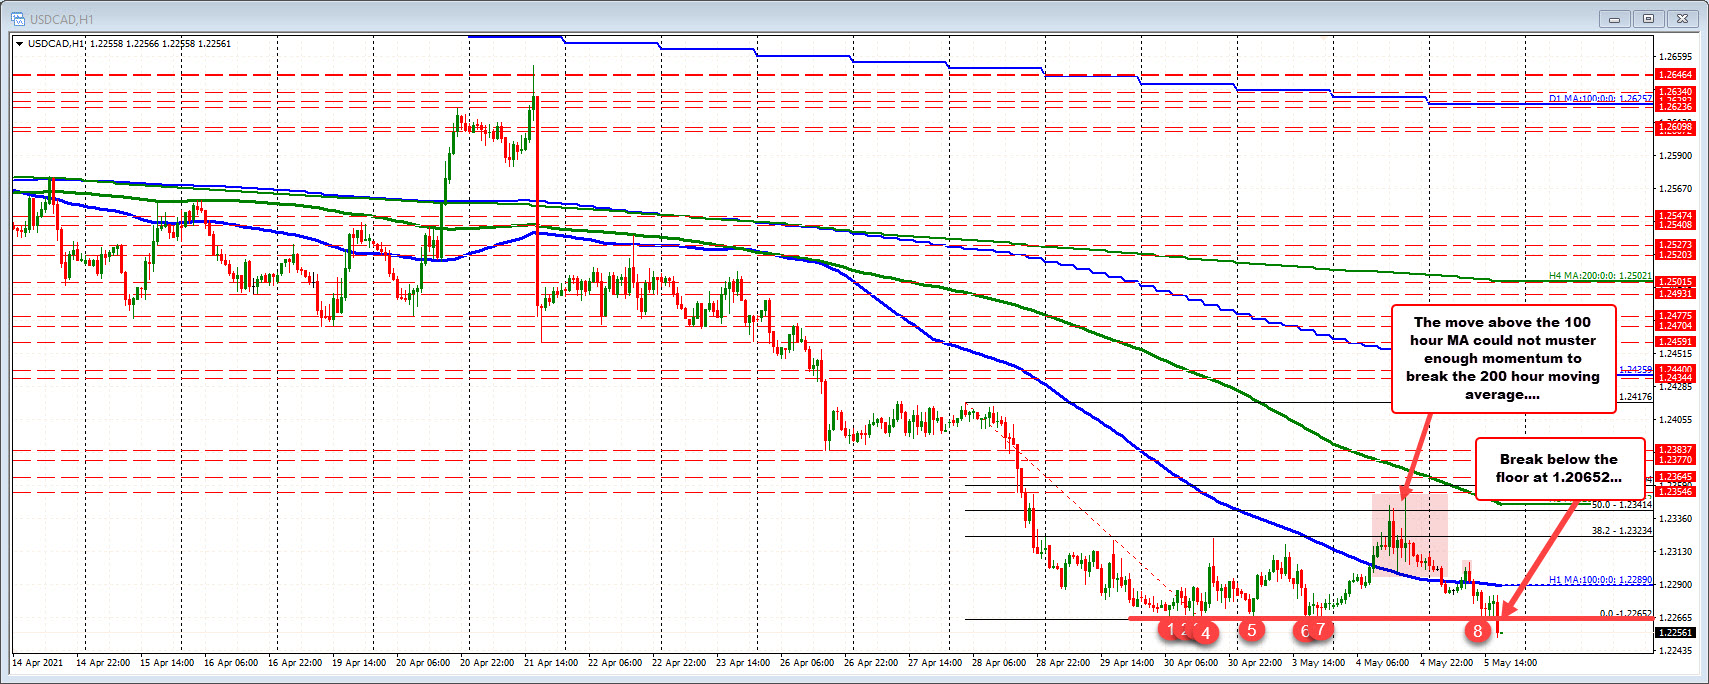
The USDCAD has fallen below a floor from recent lows on Friday, Monday and again today (see red numbered circles in the hourly chart below). That floor was at 1.22652.
The break has seen the price move down to a new 2021 low of 1.22527 (so far). Stay below the old floor keeps the sellers firmly in control.
If the price is able to get back above the floor, the buyers would still need move the price back above its 100 hour moving average at 1.22895. That moving average was broken yesterday, and again earlier today (after a dip below). However, the high price yesterday stalled well ahead of the falling 200 hour moving average (green line), and ran out of upside steam.

If the price can remain below the old floor and falling 100 hour moving average, what is the next downside target for the pair?
Taking a broader look at the weekly chart below, although the price fell below a key floor on the hourly chart, it is also approaching another key level at the 2018 low price of 1.22455. There is more work to do for the sellers.
Nevertheless, if that level can be broken, headlines will read and that the USDCAD is now trading at the lowest level since September 2017. Bearish.
The next target would then be a lower trendline that cuts across at 1.2178 on the weekly chart. Move below that level, and the 2017 low would be eyed at 1.20612.
Summary: Sellers or making a bearish play below the floor on the hourly chart at 1.22652. However, getting below the 2018 low at 1.22455 is still a key target to get to and through if the sellers are to continue the run to the downside for the USDCAD. The move back above the old floor and the following 100 hour moving average, would disappoint the sellers.


