
The 100/200 hour MAs at 1.2352 to 1.2358
The USDCAD has been mostly mired in a range between 1.23097 to 1.24089 since October 14. There was a break to the downside on Thursday of last week which saw the price move below the 1.23097 to a low of 1.2287, but within 4 hours, the price had moved back above that level and then started to re-hold support against the 1.23097 level (see blue circles 3 and 4).
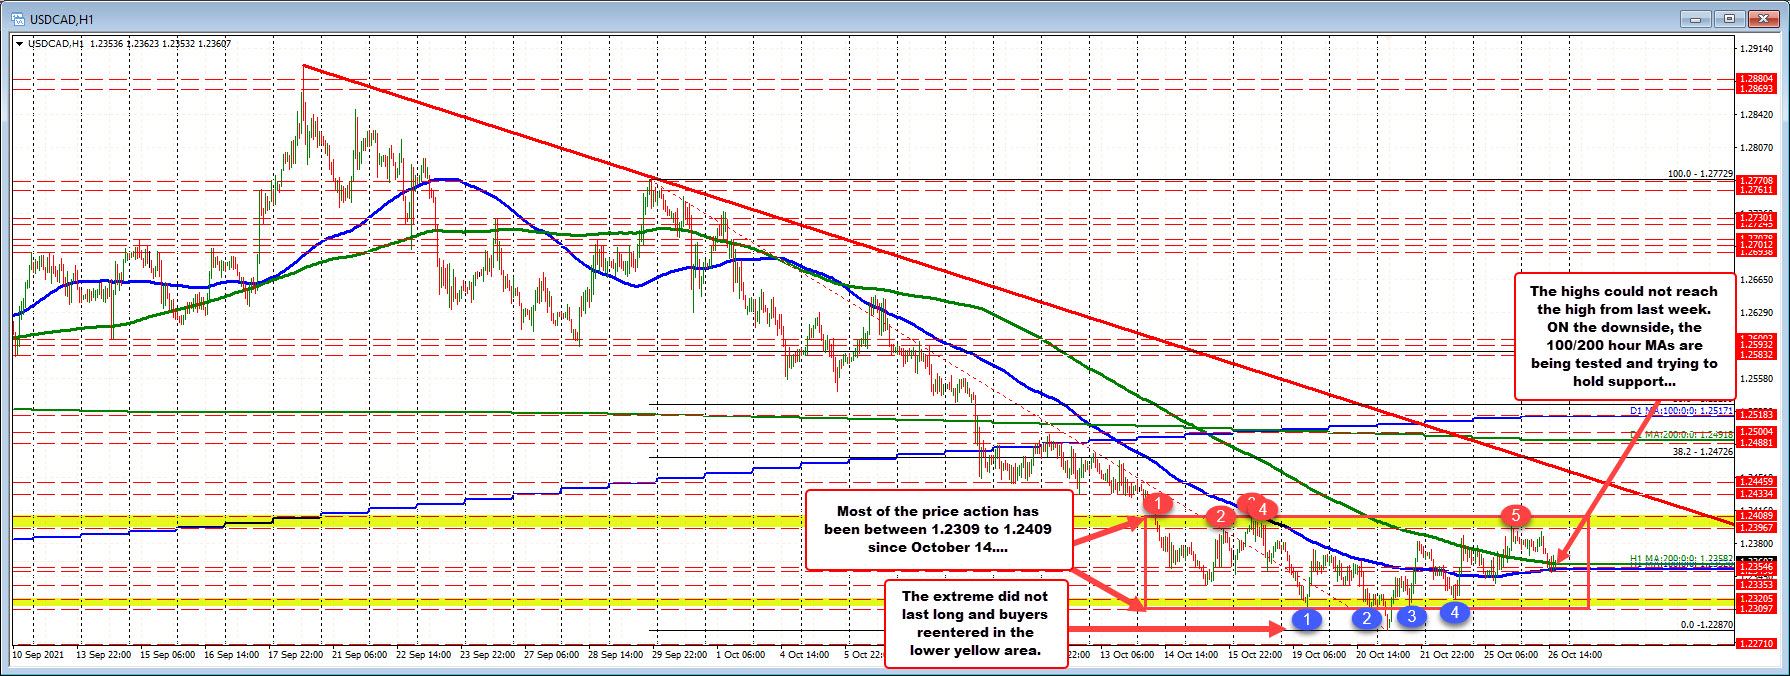
The rotation back to the upside saw the high price yesterday stall within a swing area near the high extreme between 1.23967 and 1.24089 (see red numbered circles).
Today the price rotated lower but has found support buyers near the 100/200 hour MAs (blue and green lines) which sit near the middle of the price trading range. Those MAs are holding so far. It would take a move back below to tilt the bias back in the direction of the sellers.
For now the MA levels hold support, but on the broader picture, remains in the range (red box). Getting above the aforementioned 1.23967 to 1.24089 is needed to get out the mud and give the dip buyers some comfort.
Absent that break higher (and it is a minimum move), and the buyers and sellers are still fighting for more/full control. If the MAs can be broken, the sellers take most of the control back with the lows the next targets.

