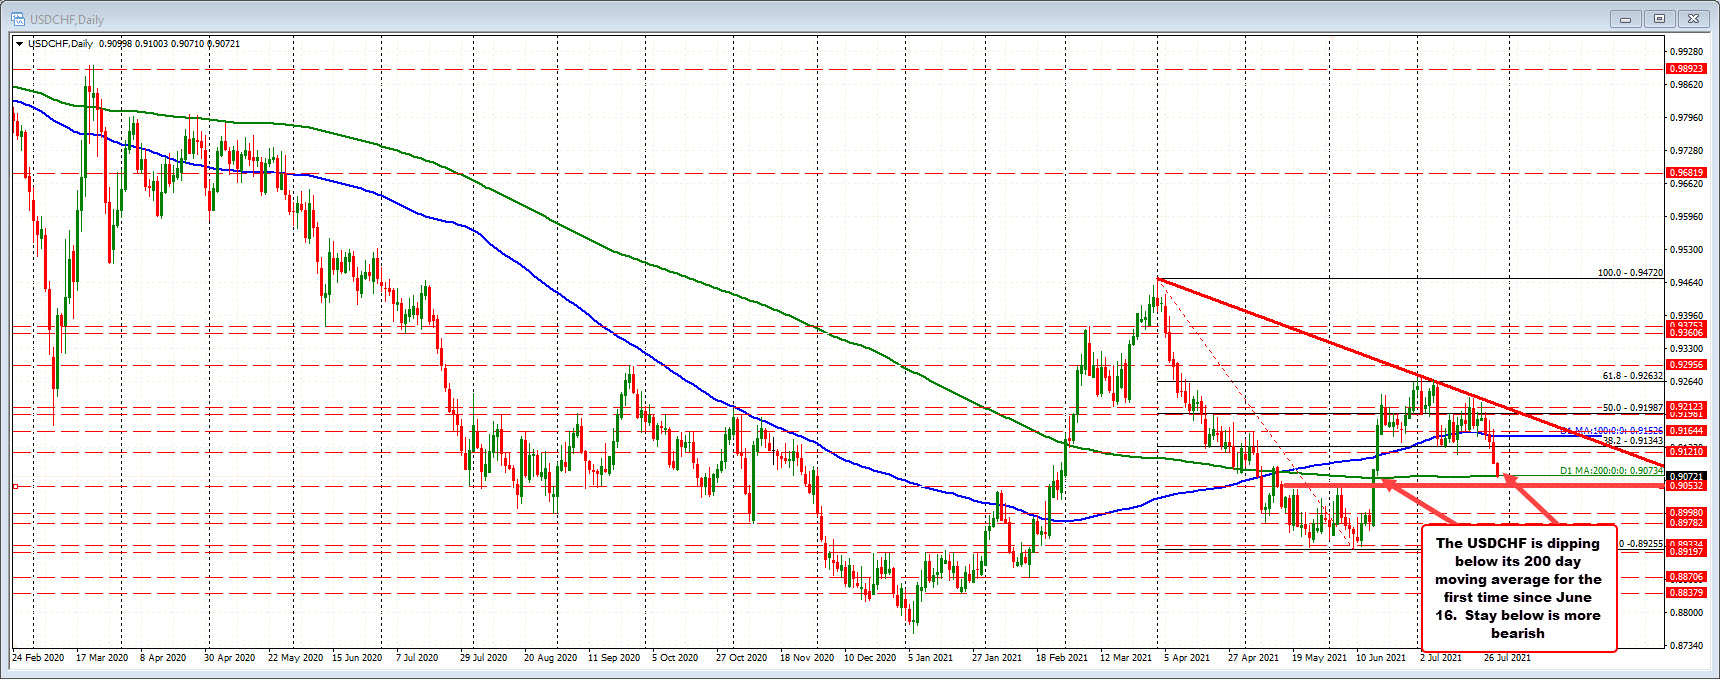
200 day moving average at 0.90734
The USDCHF has dipped below the 200 day MA at 0.90734. The pair move above that moving average line back on June 16 and stayed above. Traders will now look for the price to stay below and increase downside momentum on the break.
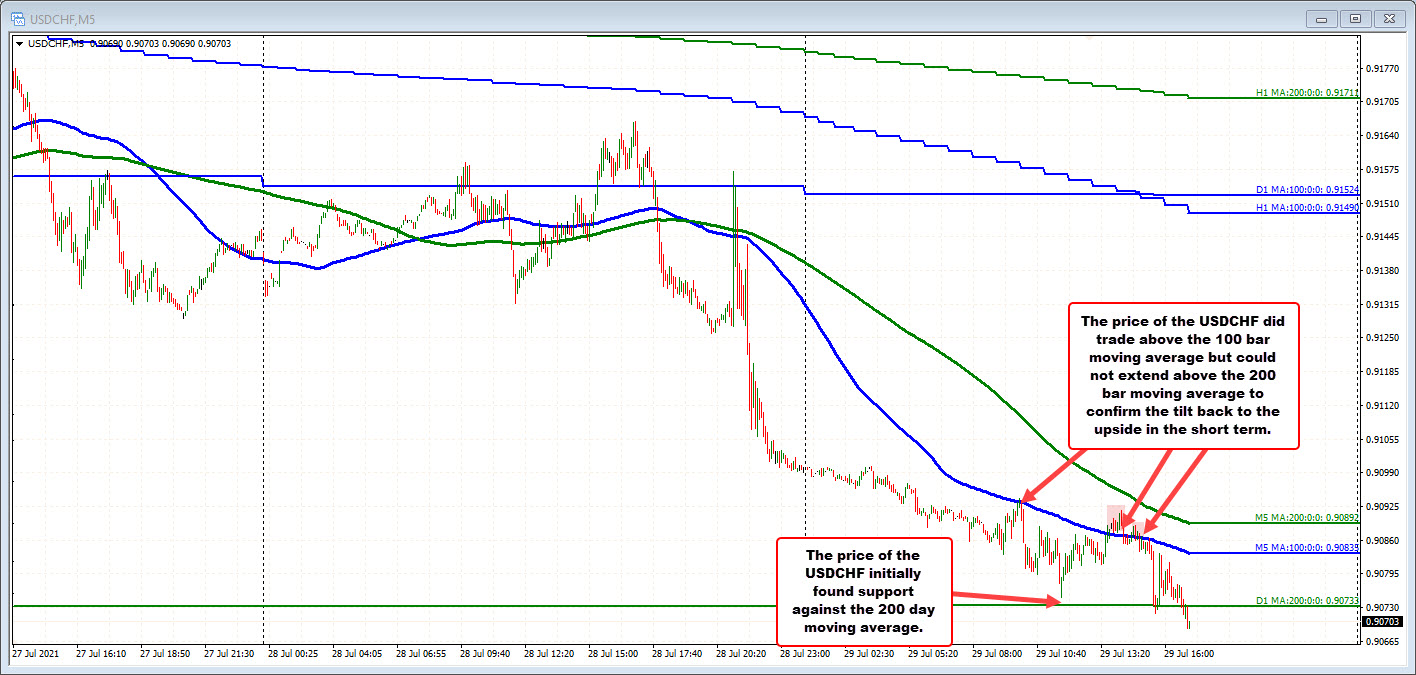
Drilling down to the five minute chart below, earlier today, the price did bounce off the 200 day moving average (see green overlay line at 0.90733). That bounce led to a modest corrective move that saw the price extend above its 100 bar moving average on the 5 minute chart (blue line). However, the price could not extend above the 200 bar moving average (green line).
Subsequently, the price moved back below the 100 bar moving average line on the 5-minute, and has stayed below, and now trades below the 200 day moving average.
Risk now?
If the momentum below the 200 day moving average cannot be sustained, traders will still need to get above the falling 100 bar moving average and 200 bar MA on the 5-minute chart, to start to tilt the bias more to the upside at least in the short term. Until then, the sellers are still in control. Be aware.