
This week saw the 100 and 200 MA on 4-hour chart broken
The USDCHF trended higher from the February 16 low. Looking at the 4 hour chart below, the pair was up 6 of the 7 weeks to the high last week at 0.9472.

This week, the trend has been lower. In the process, the pair fallen below the:
- Upward sloping trend line
- 100 bar MA (blue line currently at 0.93482), and today the
- 200 bar MA at 0.92718
The pair has moved down to test the 38.2% of the move up from the Feb 16 low at 0.9242. The low price just reached 0.92416 and bounced. The pair currently trades at 0.92572.
The holding of the 38.2% puts the trend move lower this week into perspective. Although the move lower has been trend-like, the move has been more corrective of the bigger move higher since the Feb 16 low. Yes, breaking below the trend line, 100 bar MA, and 200 bar MA are steps in the bearish direction, and has helped to swing the bias and propel sellers. However, the 38.2% is another key level that needs to be broken to tilt the bias even more lower.
For now, I would expect a battle between the 200 bar MA at 0.92718 and the 38.2% below.
With key support holding, if you drill to the 5-minute chart, there may be some clues from the battle that should ensue (see 5-minute chart below).
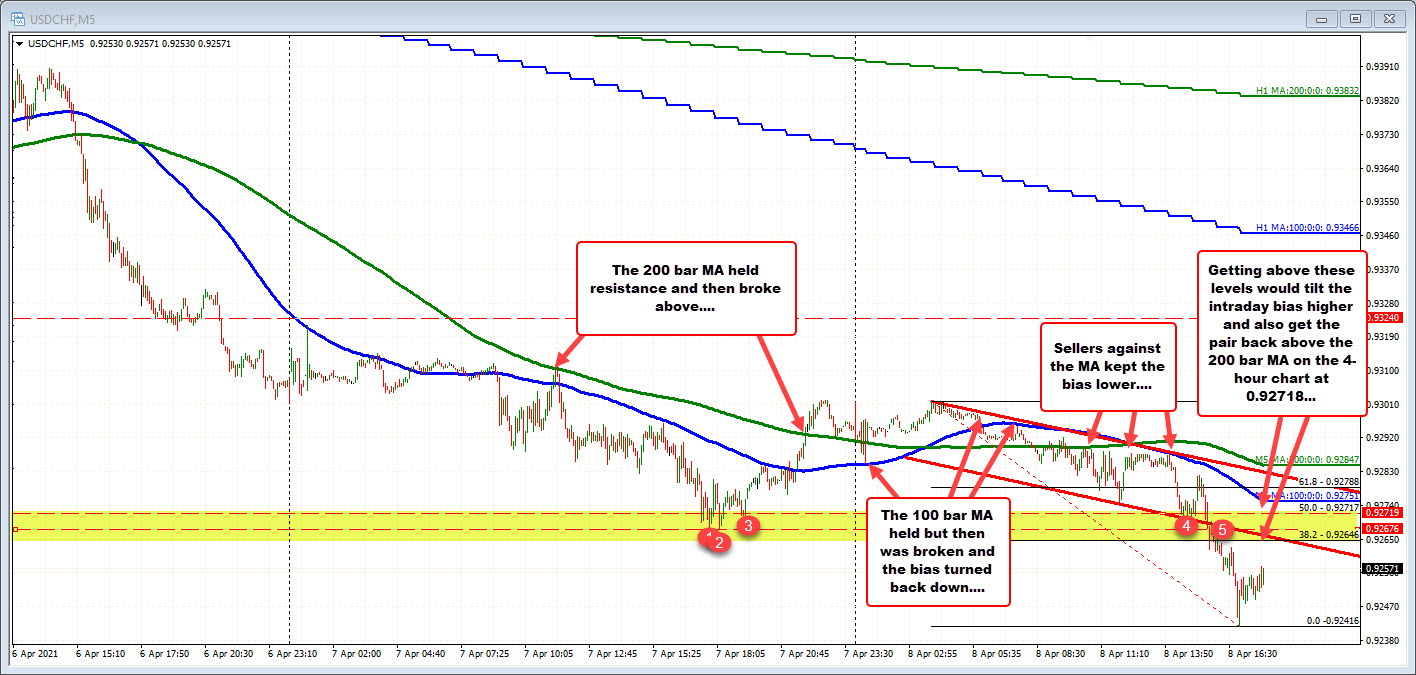
The 200 bar MA on the 4-hour chart is at 0.92718. That is right around the 50% retracement of the move down today. As such, it is a key barometer in the short term and off the 4-hour chart.
Ahead of that is the 38.2% and the swing low from yesterday at 0.92646 and 0.92676. It may be splitting hairs but would be an intraday hurdle.
Overall on the chart, note the reactions near the 100 and 200 bar MAs. Yesterday, the 200 bar MA stalled the rally. The price did move above each of the MAs late yesterday and then tried to hold support against the 100 bar MA in the Asian session today.
However, after moving back below The buying bias, turned more in favor of the sellers and the MAs became resistance levels.
Getting back above those falling MAs would also be clues if the bias is to turn more to the upside going forward.

