
The 100 day MA is now risk for the sellers.
The USDJPY has broken below its 100 day moving average at 109.403. That is the first move below the moving average since January 29, 2021. Bearish technically. It will now take a move back above that level to tilt the technical bias back to the upside. The price low traded to 109.065 (as I type).
PS. The price is also moving below its June low of 109.193 in the process today. The bears are taking more control on the daily chart

Drilling to the 5 minute chart of the USDJPY below, the pair moved sideways into the European session, but cracked below its 100 bar moving average (blue line) and has been able to stay below that moving average level (see blue line in the chart below). A corrective high also stalled below the Asian low (from the sideways market - see higher yellow area).
Since the early hours of the New York session, the price has trended more to the downside. The break below the 100 day moving average increased the bearish bias over the last hour or so.
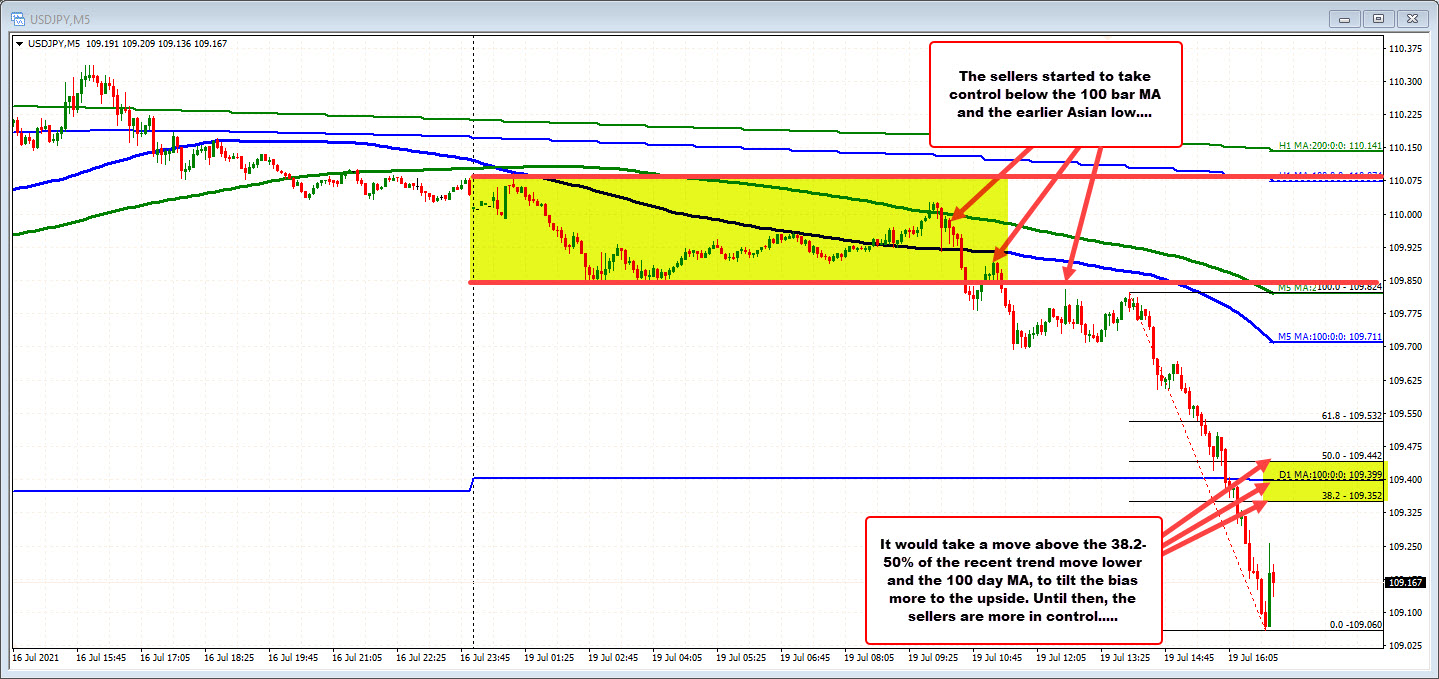
The 38.2% retracement of the last trend leg to the downside which saw the price move from 109.824 to 109.06, has the 38.2% retracement at 109.352. That is just below the 100 day moving average at 109.399. The 50% of the last trend move lower is at 109.442.
In a trending market, if the price can remain below the 38.2%/50% retracement of a "trend move lower", it keeps the bears more in control, and the trend move still in play. That area - between 109.352 and 109.442 currently (see five minute chart above) - is resistance.
With the 100 day moving average between those two retracement levels on the 5-minute chart, it increases the area for the "market". It would take a move above that area to tilt the intraday bias, back to the upside (it would also be a fail on the daily chart break of the 100 day MA).
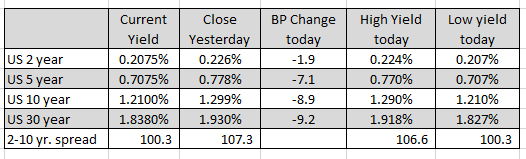
Helping the move to the downside is a continued move lower in the US stocks. The NASDAQ is now down -1.52%. The S&P index is trading down -1.72%. The Dow industrial average is down -1.94%. US yields are also maintaining sharply lower yields with the 10 year yield down -8.9 basis points and the 30 year yield down -9.2 basis point.
Drilling to the five minute chart of the

