
Testing the low for the day and the moving average/38.2% retracement
The USDJPY has been moving up and down in a trading today. The low has been defined by support against the 200 hour moving average (green line in the chart below), and the 38.2% retracement of the move down from the July high to the July low. That retracement level comes in at 110.051. The 200 hour moving averages 110.042.
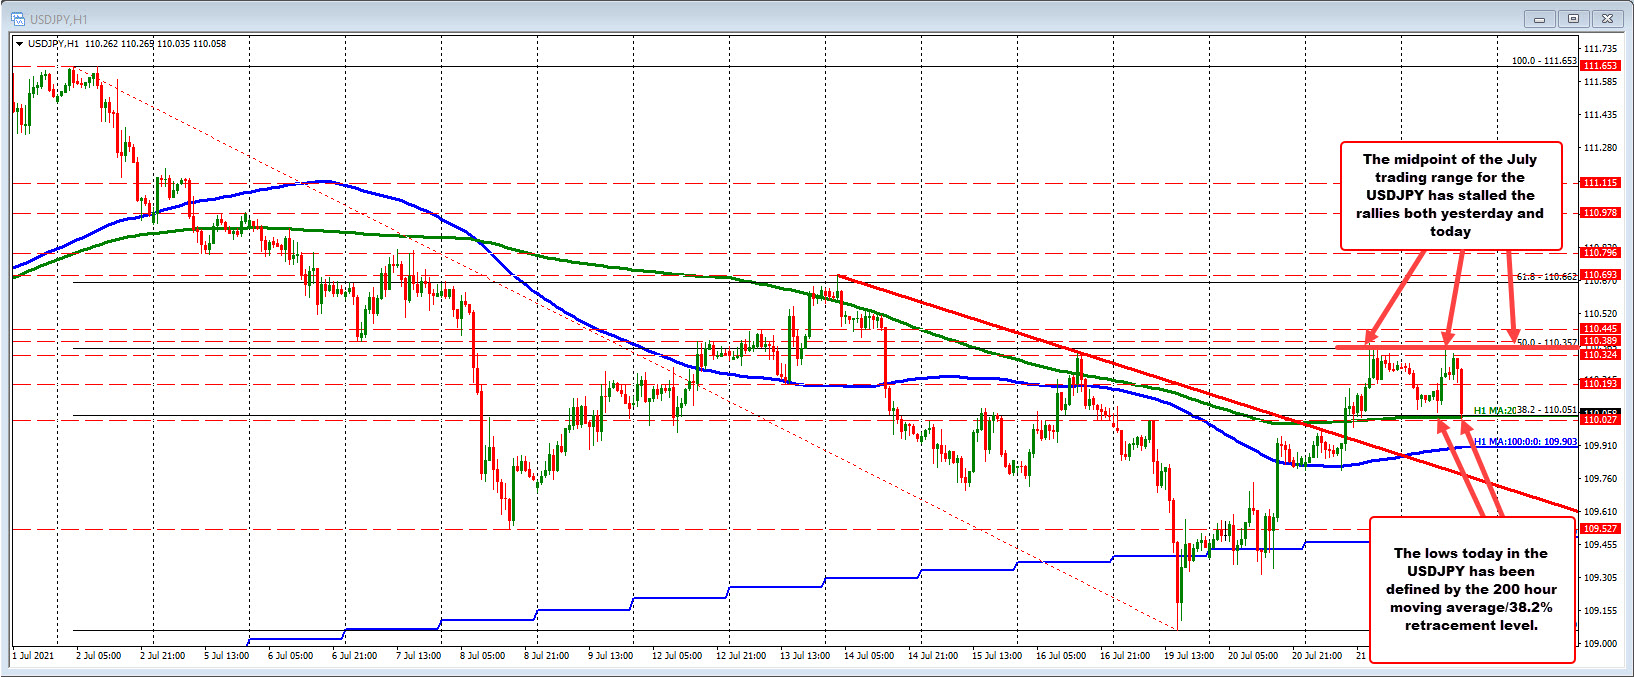
On the moves higher today, the pair stalled right at the midpoint of the July trading range at 110.357. That midpoint was also resistance in trading yesterday (a brief break above was quickly reversed).
So the market has defined the support and resistance against the technical levels. The market also awaits the next shove (either down or up). The low to high trading ranges only 35 pips so far. The average is 57 pips over the last month or so of trading. There is room to roam.
On a break of the 200 hour moving average (green line in the chart above), traders will next look toward the 100 hour moving average at 109.903 as the next key bearish hurdle. Both on Tuesday and again yesterday, the market held that moving average support level. A break below would increase the bearish bias technically.
US stocks in premarket trading, have moved to the downside (Dow down 38 points. S&P down -1.5 points) which has weakened the USDJPY. US initial claims came in much weaker than expectations (back above the 400 K level) and has traders concerned about the impact on employment from the Delta variant.

