What happens to the yen now after traders give the BOJ the big thumbs down
Who's fault is it? Kuroda for under delivering or the markets for over expecting? The outcome is the same whatever. The first drop looked very suspicious, even if it was a big sell order hitting a thin market.
We can moan and groan about what happened but it changes nothing. Yen pairs have taken a battering and we need to know what to look for next.
In my levels post yesterday I said it could be a tough event to gauge in prices compared to a data point. As I mentioned, if the price was going to stop somewhere, it would likely be a tech level, and that despite some levels being too close to have an effect in what would be volatile moves, they may have a say if the price moves away and then comes back.

USDJPY 5m chart
So what happened?
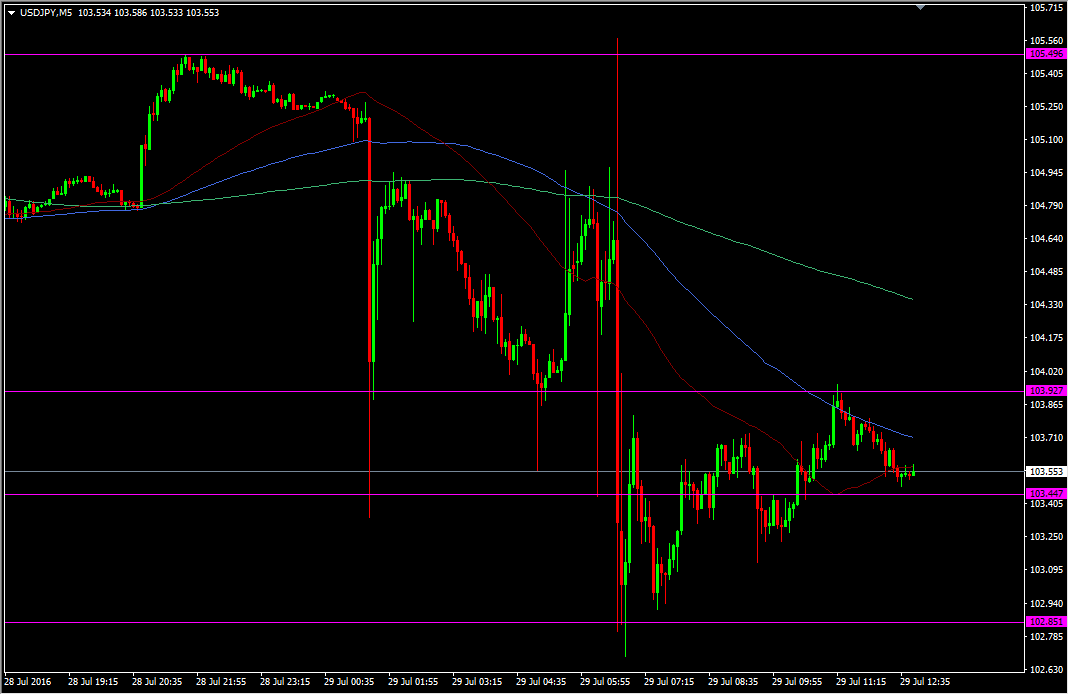
The first spill creamed 104.00 but then held up at the next level down around 103.45, give or take a few pips. Then we bounced and hit trouble back at 105.00, then we fell back towards 103.45,m then we found trouble at 105.00, then 103.45, then at the day's highs at 105.50 on the announcement spike, then we fell to the next level down around 102.85, breaking that by 15 odd pips.
Now, in the aftermath, when things have settled somewhat, we see that 103.45 showed resistance, then broke and 103.90-104.00 showed resistance, and now 103.45/50 is support.
Why am I highlighting this old news?
It's not so I can get a pat on the back about how I picked some levels that the price hit, I didn't even trade them as I was tucked up in bed. It's to show that even in the biggest and most wildest market moves, if you read the charts properly you can find the points that can define your risk, points where you have something to lean on. Now there may be plenty of other indicators you use that gave you levels, that fine, whatever works. The exercise is not jumping in on a hunch, it's finding places where you can look at the chart and say "I can trade here and can mark my risk here". If you had bought at 104 on the first drop with a stop under 103.45, you may have been stopped but you would have known you risk. If your stop was below the low under 103.45, you would have stayed in the trade and had a winner, all because you trusted the charts and trusted the levels.
Now all that is fine writing this after the event, where I can show what happened but that's why I pour over the charts before these events, so that I've got the levels beforehand. If you have the discipline to not get caught up in the excitement of a big event you can simply ignore the noise and pick a few levels you would be happy to trade, kick back and wait for them to be hit. You may win or you may still lose but you wins or loses will be defined by you and not the market. The only person in control of your trades will be you.
Now what?
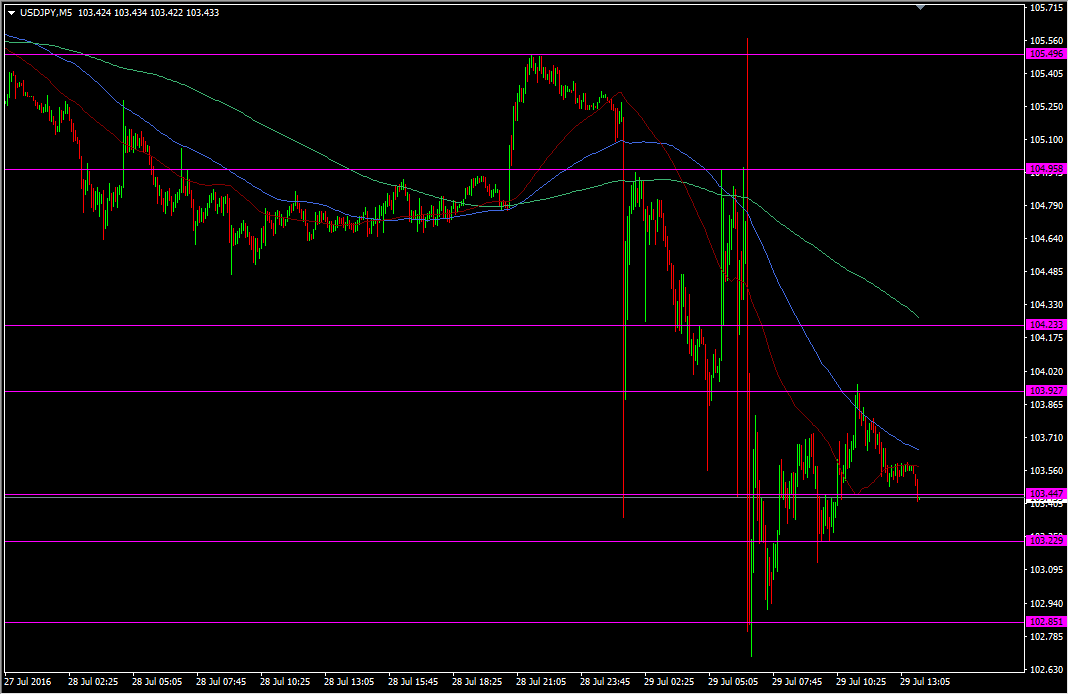
Ok, we've had the review so lets look at where do we go from here? As far as the charts are concerned, nothing's changed. We still have levels to watch and use as we see fit.

USDJPY 5m chart
I've added a couple more lines in at 103.23 and 104.23 to mark areas where there is or should be support or resistance, based on the PA.
What has changed is the markets view of things. That's important as it helps us define the markets bias from now on. I think we can safely agree that it's not bullish yen pairs right now ;-) Rally selling is likely to be the way forward right now. Unless the US GDP report is a super beat, it's probable that sellers will hit any rally that brings.
I don't think we see a complete collapse either as we still have to navigate the Abe package to come. The market might be setting its sights a little lower for that one but it's still a risk event that may keep prices fairly contained. The next moves will come when US traders start hitting their desks anytime from now, so watch for any choppy moves over the next hour or two. After that, if we haven't broken any big levels, we'll be on to the data.
At the end of the day, the market built this thing into something probably bigger than it should have been. We've still only seen prices moving in a 300 pip range top to bottom, so talk of sub-100 this and 110+ that is looking very wide of the mark.
Let the levels do the talking, know which way the market is leaning and you can trade with relative calmness and control.
For the record, I was fortunate in that my trailing stop got hit on the rest of my USDJPY long a few minutes before the first big drop, so I avoided that mess. For all the planning and strategizing, sometimes plane old luck can help you out.


