
- The latest technical analysis for Bitcoin and a follow up for the trade idea shown below is at: Bitcoin technical analysis and trade idea follow-up: Respect the 20 day EMA
- Today's daily candle, while closing only in apx 4 hours, is now showing a sign that bulls are failing to break the presented channel to the upside, following this 4th attempt to do so, on the daily timeframe.
- Even if we had a coin flip (50% chance to win, 50% chance to lose) for this trade, the reward vs risk merits to short BTCUSD here. Why? Because the profit potential is double the risk, for the first part of this trade plan, and the profit potential is 4 times the risk, for the 2nd part of the trade plan, as shown within today's BTCUSD technical analysis video
- Furthermore, some traders can leave 25% of the position riding the possible down movement, since this channel, is also a potential bear flag
Bitcoin technical analysis: Oscilators for BTCUSD on the daily timeframe
| Name | Value | Action |
| Relative Strength Index (14) | 63.04 | Neutral |
| Stochastic %K (14, 3, 3) | 82.92 | Neutral |
| Commodity Channel Index (20) | 130.92 | Sell |
| Average Directional Index (14) | 21.60 | Neutral |
| Awesome Oscillator | 1503.27 | Neutral |
| Momentum (10) | 2000.24 | Buy |
| MACD Level (12, 26) | 555.31 | Buy |
| Stochastic RSI Fast (3, 3, 14, 14) | 100.00 | Neutral |
| Williams Percent Range (14) | -12.21 | Neutral |
| Bull Bear Power | 1497.19 | Neutral |
| Ultimate Oscillator (7, 14, 28) | 52.68 | Neutral |
- Cryptocurrency 'Fear and Greed Index' is now at neutral. This supports a notion that the size of the upcoming price moves in BTCUSD, up or down, are probably going to be neutral and not extreme. Thus, traders may want to take partial profits once the move of the trade goes in their favor. Still, this contrarian gauge is a delayed indicator, and future moves in crypto can always be surprising. As such, traders, at their discretion, may want to leave a part of the trade to run further, following their partial profit taking. On the stop loss side, traders should set that according to the BTCUSD price chart and their reward vs risk appetite and trade plan.

An interesting double resistance on the BTCUSD price chart
Some traders seeking to short, may want to wait to possibly catch a more attractive entry price at the double resistance in the price range of $25250 to $25500. This would be above the round numer of $25k, which has got some 'magnet' pull power for BTCUSD. The low of 12 May, an important pivot point in the price chart, is at $25338, and one of the two resistances shown in the image below:

- Addition to the bitcoin technical analysis on the hourly timeframe: An early sign of a failed breakout above the 25k key leve
- The latest technical analysis for Bitcoin and a follow up for the trade idea shown below is at: Bitcoin technical analysis and trade idea follow-up: Respect the 20 day EMA
- Today's daily candle, while closing only in apx 4 hours, is now showing a sign that bulls are failing to break the presented channel to the upside, following this 4th attempt to do so, on the daily timeframe.
- Even if we had a coin flip (50% chance to win, 50% chance to lose) for this trade, the reward vs risk merits to short BTCUSD here. Why? Because the profit potential is double the risk, for the first part of this trade plan, and the profit potential is 4 times the risk, for the 2nd part of the trade plan, as shown within today's BTCUSD technical analysis video
- Furthermore, some traders can leave 25% of the position riding the possible down movement, since this channel, is also a potential bear flag
Bitcoin technical analysis: Oscilators for BTCUSD on the daily timeframe
| Name | Value | Action |
| Relative Strength Index (14) | 63.04 | Neutral |
| Stochastic %K (14, 3, 3) | 82.92 | Neutral |
| Commodity Channel Index (20) | 130.92 | Sell |
| Average Directional Index (14) | 21.60 | Neutral |
| Awesome Oscillator | 1503.27 | Neutral |
| Momentum (10) | 2000.24 | Buy |
| MACD Level (12, 26) | 555.31 | Buy |
| Stochastic RSI Fast (3, 3, 14, 14) | 100.00 | Neutral |
| Williams Percent Range (14) | -12.21 | Neutral |
| Bull Bear Power | 1497.19 | Neutral |
| Ultimate Oscillator (7, 14, 28) | 52.68 | Neutral |
- Cryptocurrency 'Fear and Greed Index' is now at neutral. This supports a notion that the size of the upcoming price moves in BTCUSD, up or down, are probably going to be neutral and not extreme. Thus, traders may want to take partial profits once the move of the trade goes in their favor. Still, this contrarian gauge is a delayed indicator, and future moves in crypto can always be surprising. As such, traders, at their discretion, may want to leave a part of the trade to run further, following their partial profit taking. On the stop loss side, traders should set that according to the BTCUSD price chart and their reward vs risk appetite and trade plan.
An interesting double resistance on the BTCUSD price chart
Some traders seeking to short, may want to wait to possibly catch a more attractive entry price at the double resistance in the price range of $25250 to $25500. This would be above the round numer of $25k, which has got some 'magnet' pull power for BTCUSD. The low of 12 May, an important pivot point in the price chart, is at $25338, and one of the two resistances shown in the image below:
- Addition to the bitcoin technical analysis on the hourly timeframe: An early sign of a failed breakout above the 25k key leve

For traders taking the short, they may consider the Fibonacci levels of the range between the recent high $25054 and the low of the range, $18755 (the low of 18 June, 2022). Fibonacci retracement level is 78.6%, which is at BTCUSD of just under $23500. The idea is that the price may reverse there, even temporarily, if it gets there. Accordingly, traders can cover a part of their short position, for example, 25% of their position, at a profit. This allows them more comfort for the next duration of the trade.

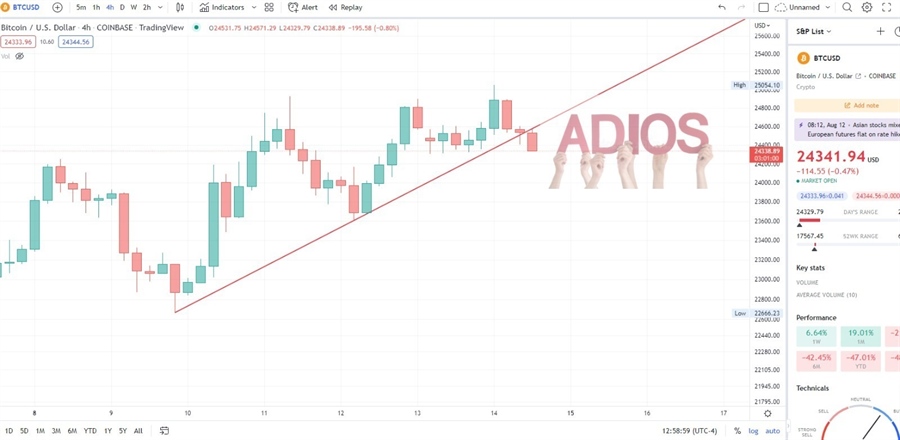
BTCUSD may be saying 'Adios' after crossing down this red line, retesting it, and then bulls seem to have given up. 4 hour candles.
Technical analysis update for 15 Aug: Bulls are fighting back with a retest of the previously broken support (red line in the above and below BTCUSD price chart). Bears would either add to their short here or wait and see of price breaks back in. Should a 4 hour candle close towards the high of the candle, and above that red line, then bulls are showing strength and bears may even choose to set their stops at the original entry, due to this comeback sign by the bulls. We shall wait and see what happens in the next 24 hours (visit this page for further updates).

Bitcoin technical analysis update for 15 Aug: Following another "fakie" above the recent high and the 25k mark, bitcoin is testing the diagonal line, now acting as support. Watch for 4 hour candles to close above the recent high or below the VWAP (purple line). The stop loss of the original trade idea, presented in the video at the top of this page, is still active and has not been reached, despite the recent rally. When trading crypto, one must have healthy stops, rather than close or "obvious" ones that most others would set.
Updated BTCUSD analysis for end of 15 August: See where potential profit taking of the short trade can be executed, that are in line with the technicals. Or just stick to the original trade idea.
Interested in crypto? Visit ForexLive for technical analysis and crypto news.
The latest technical analysis for Bitcoin and a follow up for the trade idea shown below is at: Bitcoin technical analysis and trade idea follow-up: Respect the 20 day EMA
Tags: , BTC, BTCUSD, bitcoin , bitcoin price forecast, bitcoin trade idea

