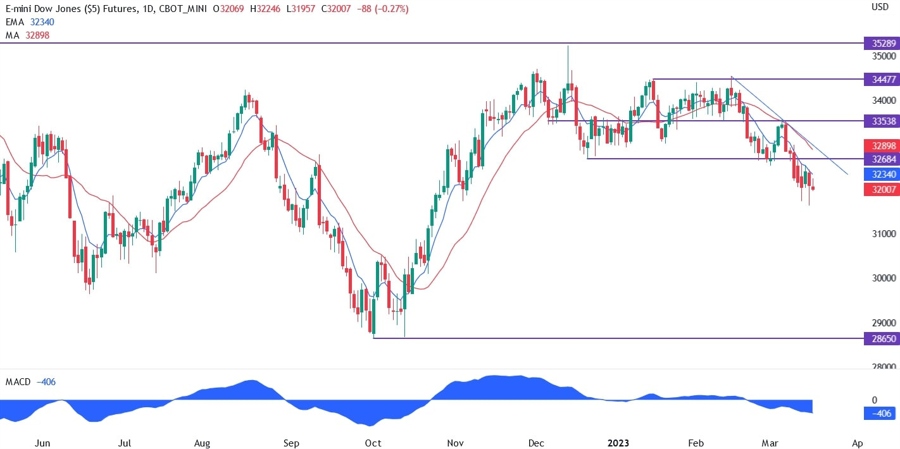
On the daily chart below, we can see that the key support at 32684 was breached and the sellers started to pile in pushing the price to new lows. The market fell as the Silicon Valley Bank failed last Friday causing risk aversion across the board. On Monday and Tuesday the market rebounded a little as the actions taken by the Treasury and the Fed calmed the markets.
Yesterday, the fears came from Europe as Credit Suisse was once again under stress. Later in the day the SNB offered support for the bank and the market bounced again. The sellers are in control, but they are struggling to push lower as expectations of rate cuts are giving the buyers some fuel to keep pushing up.
The sellers may want to wait for the price to pull back to the support now turned resistance, the trendline and the red long period moving average as the confluence of all these technicals gives a strong level where they can lean on with defined risk.
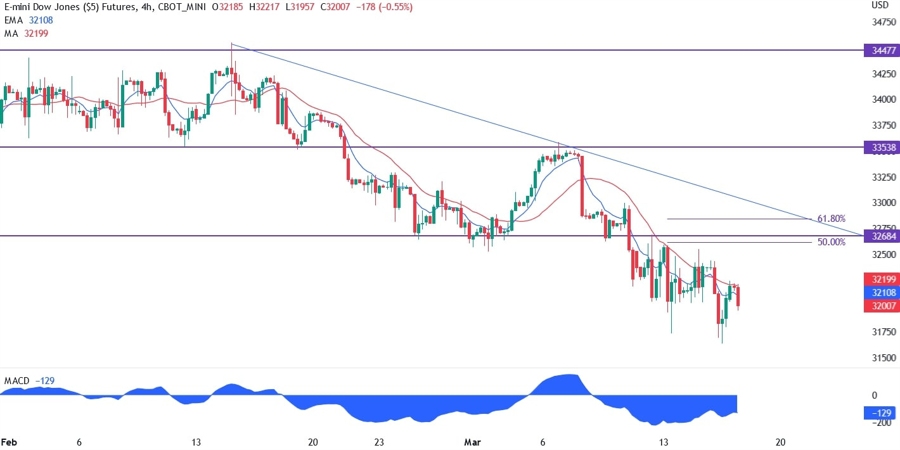
On the 4 hour chart below, we can see that the resistance at 32684 has also the 50 and 61.8% Fibonacci retracement levels. There’s also a divergence between the price and the MACD signalling that the selling momentum is weak and we may indeed see a pullback. From a risk management perspective, the best thing to do for the sellers is to wait for the price to come to that resistance and lean on it with defined risk.
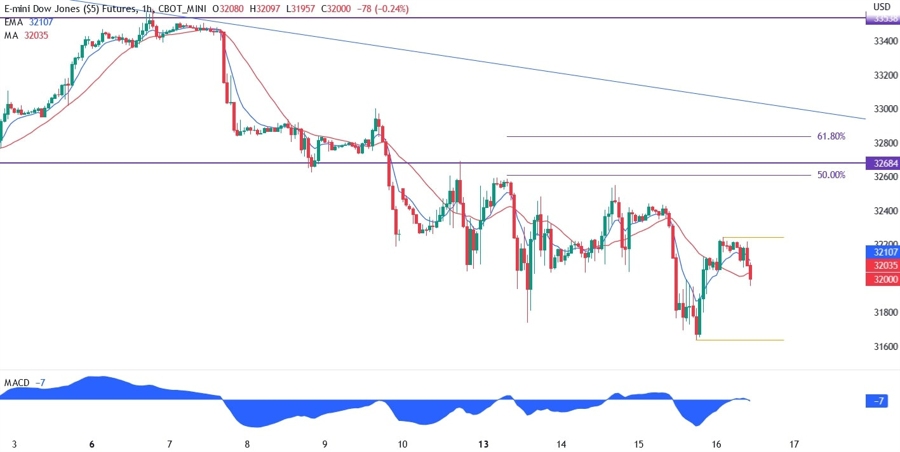
In the 1 hour chart below, we can see that at the moment there’s some selling pressure. If we see the buyers pushing the price above the orange swing resistance at 32245, then we may see them extend the rally to the 32684 level. On the other hand, if the sellers manage to break the orange swing low at 31640, then they may extend the selloff.