On the daily chart below, we can see that GBPJPY has broken out of the 172.19 level, and it may now be pulling back to retest the resistance turned support. We’ve been seeing the pair rallying for a couple of months as the divergence between the BoE and BoJ’s monetary policies keeps widening.
In fact, recent hot inflation data from the UK raised the market odds for more rate hikes from the BoE as it has the highest inflation rate among the majors. The moving averages have been acting as dynamic supports, so we may expect the buyers to lean on them again going forward, all else being equal.
GBPJPY Technical Analysis

On the 4 hour chart below, we can see that we have a divergence with the MACD and that usually indicates a weakening momentum often followed by pullbacks or reversals. An eventual pullback should come to the strong support zone at the 172.16 level where there’s confluence of the upward trendline and the 38.2% Fibonacci retracement level.
The buyers are likely to pile in on this level with a defined risk just below the trendline and target a break above the 174.00 high. The sellers, on the other hand, will want to see this support zone to break to jump onboard and extend the fall towards the 168.00 support.

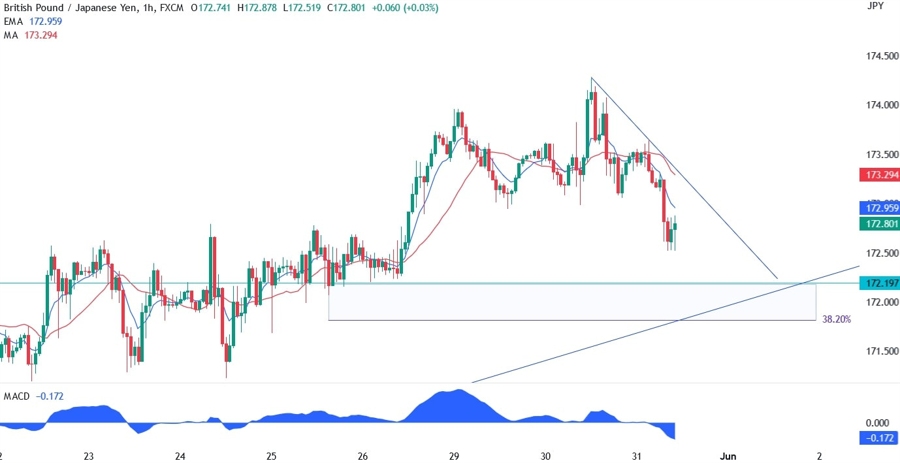
On the 1 hour chart below, we can see the short term price action in GBPJPY with the price bouncing from the 172.50 level. Traders will be watching the counter-trendline as that’s where the sellers should position for another fall towards the 172.16 support. The buyers, on the other hand, will look forward to a break above the counter-trendline to extend the rally towards the 174.00 high and beyond.