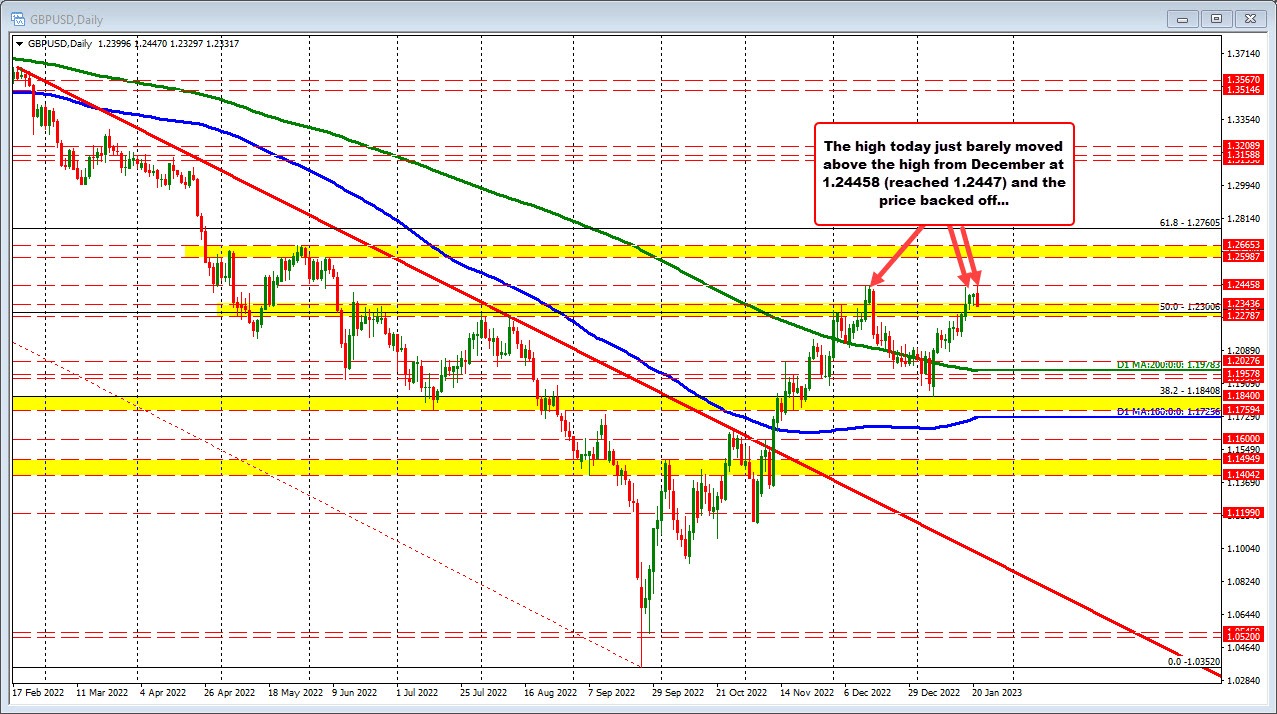
The buyers had their shot in the GBPUSD today.
In the Asian session, the price of the GBPUSD moved higher and in the process did move above the high from last week at 1.24348. The December high at 1.24458 was the next close target, and the price did reach that level. However, after reaching 1.2447 just 1.2 pips above the December high, buyers turned to sellers and the price started a rotation back to the downside. The buyers had their shot. They missed.
Staying on the daily chart the 50% of the range going back to early June 2021 is the next downside target at 1.2300. That is within a swing area between 1.2278 and 1.2236. The low today has reached into that swing area at 1.23297. Traders will be looking toward the 1.2300 midpoint on the downside on the daily chart now.
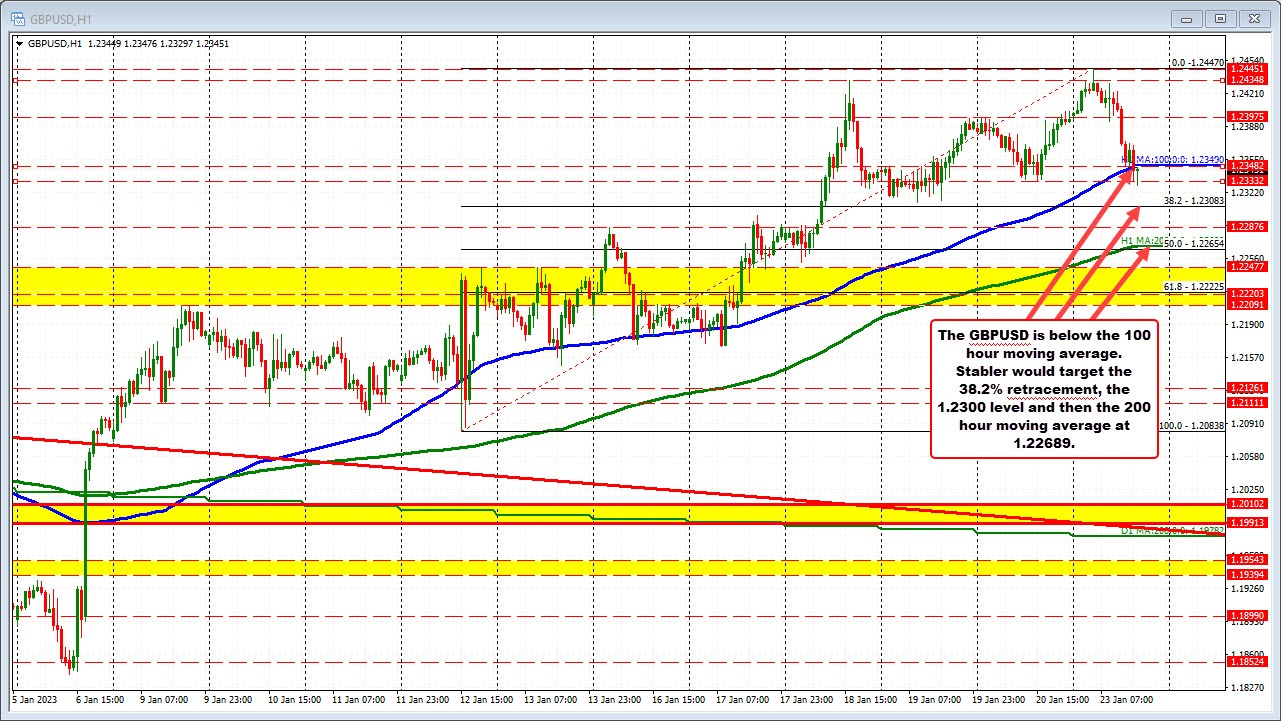
Drilling down to the hourly chart below, the last move to the downside, has now taken the price back below the 100 hour moving average at 1.2340. The sellers are trying to keep the lid against that level. If successful, that would be the best case scenario for the shorts looking for more downside momentum. Move back above and could see some rotation back to the upside in the short term on the failed break.
On the downside, the 38.2% retracement of the move up from the January 12 low is down at 1.23083. That retracement level on the hourly chart is near the low levels from last Thursday's trade. Remember also that the 50% retracement from the daily chart (going back to June 2021) comes in at 1.2300.
Move below those levels, and the rising 200 are moving average (green line in the chart below) comes in at 1.22689 and would be another target. The price of the GBPUSD has not traded below the 200 day moving average since January 6.


