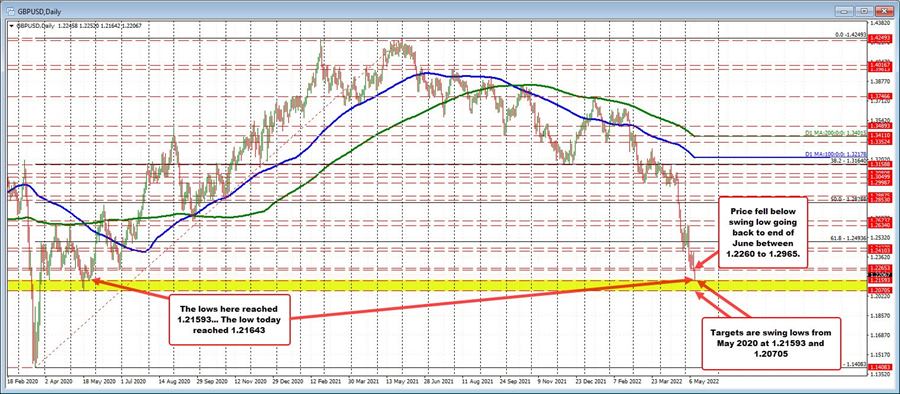
The GBPUSD moved to a session low of 1.21642. That got within 5 pips of the next key swing low target on the daily chart above from May 22, 2020 at 1.21591. Looking at that chart, a move below that level would target the May 18 low next at 1.20705. That was the lowest level going back to March 2020 (Brexit tumble).
Yesterday, the price moved down to test the swing lows from the end of June between 1.2260 and 1.2265. The price of the GBPUSD broke below that area in the late New York session yesterday, and closed below. The price has stayed below that area in trading so far today. The corrective high into early US morning session reached 1.22472. The current price trades at 1.2220.
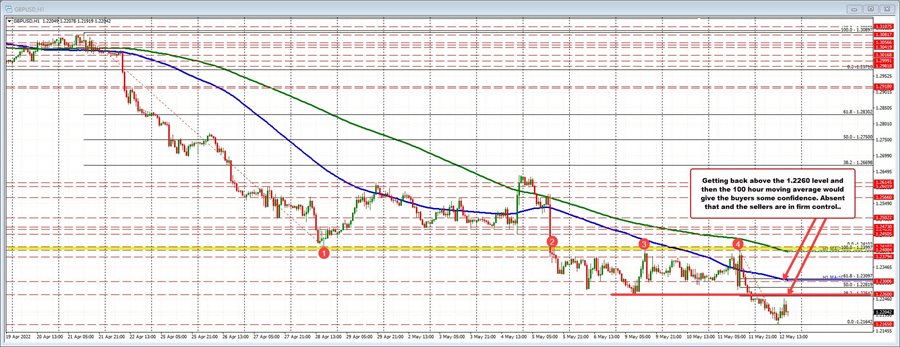
It would take a move back above the 1.2260 – 1.2265 area to give the buyers some hope.
Drilling to the hourly chart below, the price action has seen a rebound in early New York trading with the high price reaching 1.2247, but sellers have pushed the price back down. In addition to getting above the 1.2260 – 1.2265 area, buyers would need to push the price back above the 100 hour moving average (blue line in the chart below) currently at 1.23048 to give buyers some more hope.
Yesterday, the price trade above and below that 100 hour moving average level on CPI volatility flows, but the high price stalled near a higher swing high area between 1.2400 and 1.24107 (see red numbered circles in the chart below). The 200 hour moving average is near that area as well today, and would be a another target to get to and through if the buyers are to take more control going forward.