
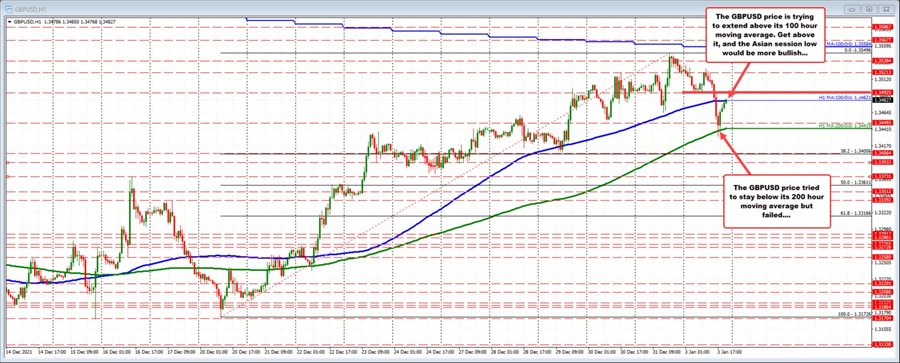
The GBPUSD is up retesting - now moving above - the 100 hour MA at 1.34821 despite the continued rise in yields (10 year up 13.2 basis points).
Earlier today, the price tested that moving average line before breaking below the level on it's way to the 200 hour moving average (green line). The price briefly dipped below the 200 hour moving average on 2 separate hourly bars, but recovered, and has seen higher levels on four consecutive hourly bars. More momentum above the moving average would have traders looking toward the swing low from the Asian session near 1.3493. Move above that level and it should open the door for further upside momentum.
If the 100 hour moving average and 1.34925 level stalls the upside, both the sellers and buyers would have failed on breaks of the 100/200 hour MA lines today. That typically leads to some consolidation as traders await for the next shove (with more momentum) outside one of the MA levels.
For now the buyers are making a play. Can they keep the momentum going?

