
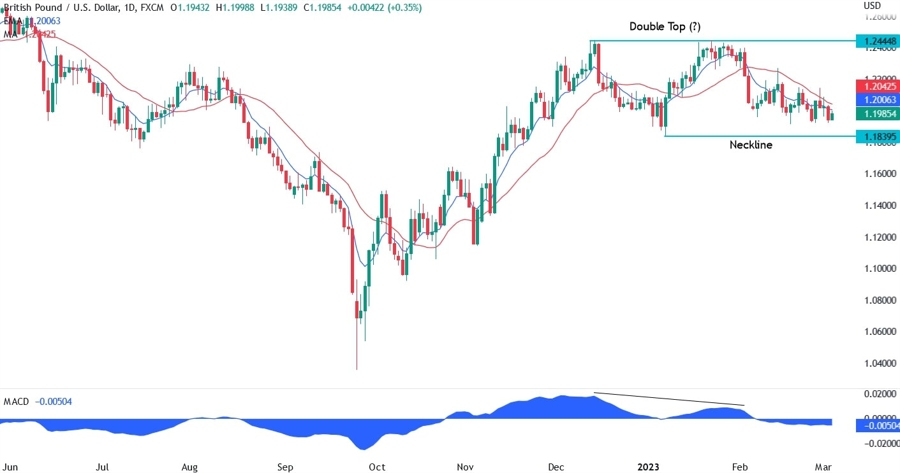
On the daily chart below, we can see that the price started to lose momentum falling into the neckline support at the 1.1839 price level. The moving averages are acting as resistance and the sellers keep leaning on them.
This suggests a bearish bias as the economic data keeps coming in hot like the ISM Manufacturing PMI report and the Fed is starting to lean on the more hawkish side like Fed’s Waller suggested yesterday.
Today we will have the ISM Non-Manufacturing PMI report and if that beats expectations we are likely to see more selling pressure with a possible breakout of the neckline.
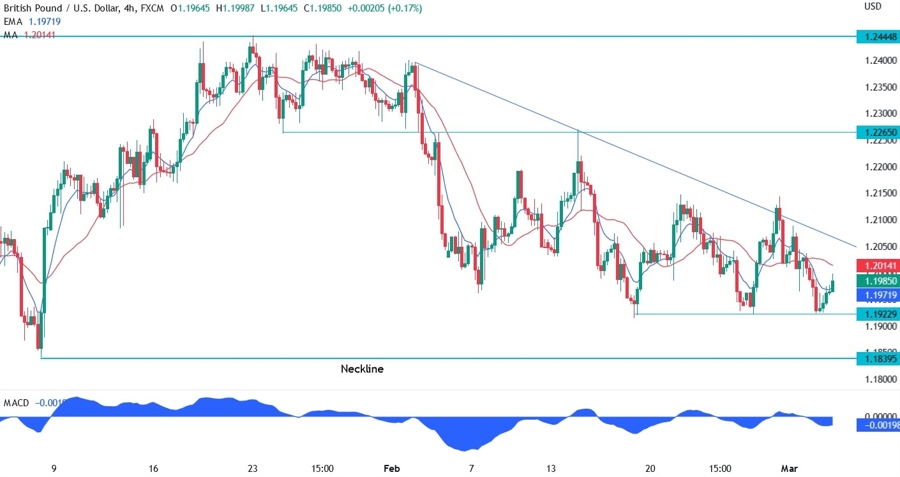
On the 4 hour chart below, we can see how the sellers leant on the trendline and pushed the price lower. This is starting to look like a descending triangle pattern with the base at the 1.1922 level.
The sellers will eye a break below that level to get even more conviction for a breakout of the neckline. The buyers will need a break above the trendline to get the conviction to make higher highs.
On the 1 hour chart below, we can see the key levels of the current range. We have the resistance at 1.2143 and the support at 1.1922. Today will be all about the ISM report and the market will go where the data will take it.
If the data beats expectations, especially the “prices” sub-index, then we will see the sellers in full control and the support giving way. If the data misses expectations, we will see a rally towards the trendline.


