On the daily chart below, we can see that the price is struggling to break above the 12660 resistance as a hawkish repricing in interest rates expectations and negative headlines on the debt ceiling front are weighing on the Nasdaq .
The major bullish flag is still playing out perfectly and the target for that is the 13000 price zone. As things stand, we may get a pullback into the trendline first where the buyers will also have the red long period moving average as support.
Nasdaq Technical Analysis

On the 4 hour chart below, we might have a possible double top at the 12660 resistance with the neckline standing at the 12420 level. This would be a good setup for both buyers and sellers. The buyers will lean on that neckline with the trendline and the daily red long period moving average as support to target a break above the 12660 resistance. The sellers, on the other hand, will wait for a break below the neckline and the trendline to start positioning for a bigger selloff into the 11800 swing low level.

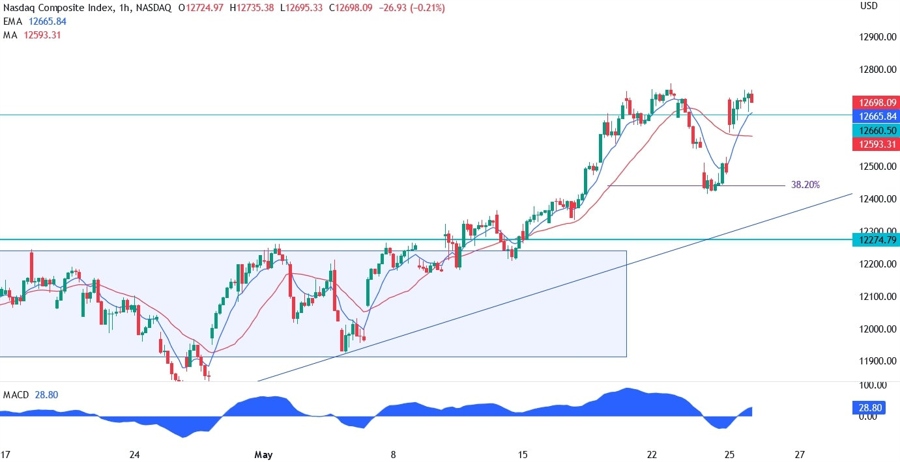
On the 1 hour chart below, we can see more closely the short term price action in the Nasdaq. The recent pullback bounced from the 38.2% Fibonacci retracement level, so we may expect buyers again there if the price pulls back again.
Alternatively, if the Nasdaq starts to break above the 12755 high, the buyers should pile in as the bullish momentum would be in their favour. Today, the only risk event is the US PCE report. In case we get a beat, we should see the pullback into the 12420 level, but if we get a miss, we should see the Nasdaq rallying to new highs.