
Watch the following technical analysis for Russell 2000 (30 second video):
The area close to 1800 seems to be a 'magnet' pulling the price to it. If and when it gets to the double support shown within the video, watch for shorts to cover and early bulls to take some Long bets. That spot introduces an attractive reward vs risk ratio for the bulls. However, if the price continues to fall, then we might have a confirmed bear flag broken to the downside.
Will Russell be getting worse as shown below by Bloomberg, or will it stop close to 1800?
Russell 2000 Capitulates: The small cap-heavy index is down 20% from November highs, on track to enter bear market. More than one-fourth of the index’s components had hit 52-week lows on Friday - the highest reading since March 2020 https://t.co/2AT7Djugqg pic.twitter.com/vmzyA7EveF
— Bloomberg (@business) January 24, 2022
I will be looking for a Long if Russell 2000 futures gets close to 1800. Why? At that price, my stop would fairly close but my profit target would being further out, and, thus, interesting. Watch the double support on the technical chart as shown in the video. Also watch for possible comments below. In any case, this is all just my opinion, and not a trade recommendation.
Trade Russell 2000 futures at your own risk. See ForexLive.com technical analysis for addtitional perspectives.
As per the Nasdaq futures (NQ) on the hourly timeframe, price might be breaking down this potential bear flag. If so, that might be adding or synchronizing the pressure on the Russell 2000, as well.
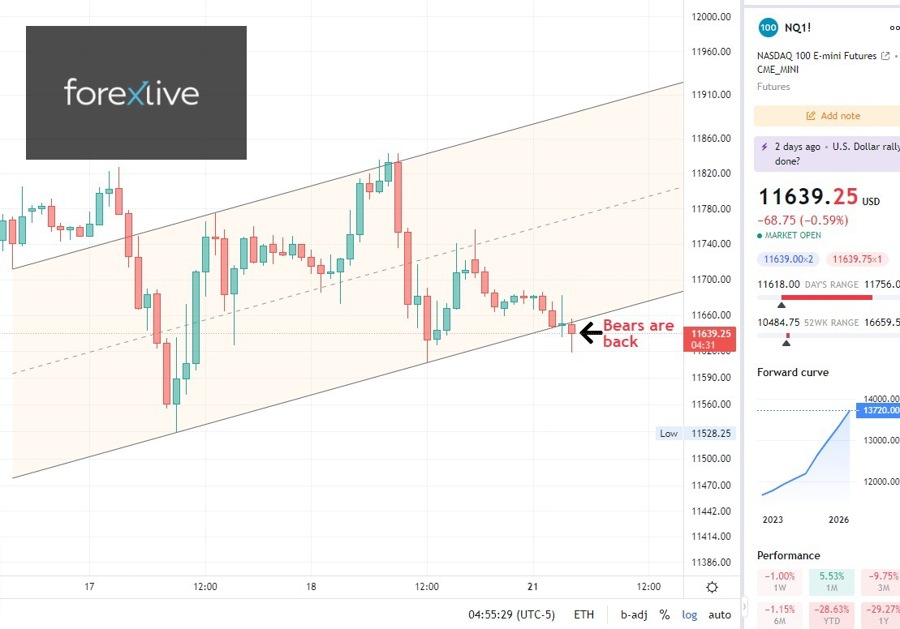
Chart by TradingView, where one can get additional technical analysis ideas on the Russell 2000 futures (RTY).

