- S&P Futures continues to look okay for the bulls but in this jittery market where close stops can easily be hit, and mediocre entry prices are exposed to choppy price action, we focus today on targeting a more attractive entry to our Long.
- See 3 trade ideas in the video and understand the technical logic behind the location of the stop loss, the take profit target and the reward vs risk
- Note the 2 price ranges in today's technical analysis and see how we use them as anchors for our trades. Our video today provides a view and, still, bullish bias, for the Emini, as well as focuses on targeting a more attractive entry to your Long, or where existing Long trades may consider adding to their existing position
- Remember that in trading, and especially in trading futures, there is always a price to pay as we aim to gain a benefit. In this case, the lower entry price for our Long is not just handed to us for free. The risk is that the buy order will not get filled.
- Watch the following video and trade the S&P 500 E-mini Futures (ES) at your own risk
Futher to the above video analysis, on the daily timeframe, watch for the S&P Futures or S&P Index (SPX) during normal trading hours, to possibly close the gap, in the near future, perhaps this week, reaching 3896.50.
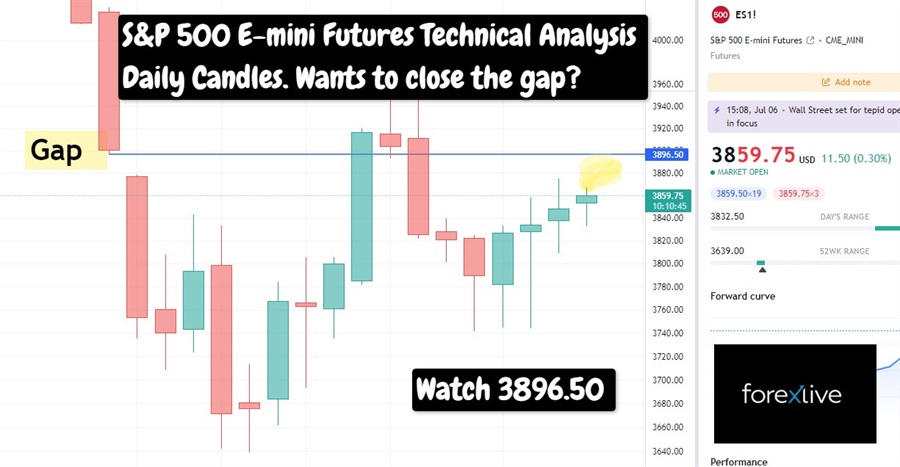
Visit ForexLive.com for technical analysis Technical Analysis In financial trading, technical analysis refers to the method of studying the previous history and price movements of an instrument, such as foreign exchange, stocks, commodities, etc.Key determinants include an asset’s historical price action, chart patterns, volume, and other mathematical based visual tools, in order to predict future movements of that instrument. Traders who utilize various means of technical analysis are known by a variety of terms, such as technical traders, technical analysts, or technicians.The crux behind technical analysis is the notion that past performance of a financial asset is a potential evidence for future activity. Unlike fundamental analysis, technical analysis does not bother with the causes of price fluctuations; it only deals with its effects. Therefore, technical traders diligently observe historical charts of the instrument they’re interested in trading. By applying a number of techniques, technical analysis ultimately helps forecast how prices will act, sometimes in relation to time as well. There are a multitude of visual tools available for the technical trader, with the most popular of them included in all of the major broker platforms today. Understanding Technical AnalysisTechnical analysis itself consists of a number of different methods, which generally fall into two main categories – leading indicators or lagging indicators. Leading indicators refer to those charting tools which enable the trader to predict the movement of an asset before it actually occurs. Such leading techniques include Fibonacci, pivot points, trend lines, divergence and harmonic trading, and are popular with traders who prefer to trade reversals. Lagging indicators are those visual tools which enable a trader to take advantage of a strong trend, entering upon it whilst in formation; such tools include the MACD, the Awesome Oscillator, and moving averages. Technical traders don’t all use the same tools of course, and even a trader that uses a particular indicator. For example, the Stochastic Oscillator will probably use it in a different manner to another trader using the same indicator or set of indicators, making technical analysis extremely subjective. Having said that, there is merit to technical trading, and as unintuitive as it may seem, previous price patterns do appear time and time again.As an increasing number of traders seek specific market points, the probability of those points holding significance also increases. In financial trading, technical analysis refers to the method of studying the previous history and price movements of an instrument, such as foreign exchange, stocks, commodities, etc.Key determinants include an asset’s historical price action, chart patterns, volume, and other mathematical based visual tools, in order to predict future movements of that instrument. Traders who utilize various means of technical analysis are known by a variety of terms, such as technical traders, technical analysts, or technicians.The crux behind technical analysis is the notion that past performance of a financial asset is a potential evidence for future activity. Unlike fundamental analysis, technical analysis does not bother with the causes of price fluctuations; it only deals with its effects. Therefore, technical traders diligently observe historical charts of the instrument they’re interested in trading. By applying a number of techniques, technical analysis ultimately helps forecast how prices will act, sometimes in relation to time as well. There are a multitude of visual tools available for the technical trader, with the most popular of them included in all of the major broker platforms today. Understanding Technical AnalysisTechnical analysis itself consists of a number of different methods, which generally fall into two main categories – leading indicators or lagging indicators. Leading indicators refer to those charting tools which enable the trader to predict the movement of an asset before it actually occurs. Such leading techniques include Fibonacci, pivot points, trend lines, divergence and harmonic trading, and are popular with traders who prefer to trade reversals. Lagging indicators are those visual tools which enable a trader to take advantage of a strong trend, entering upon it whilst in formation; such tools include the MACD, the Awesome Oscillator, and moving averages. Technical traders don’t all use the same tools of course, and even a trader that uses a particular indicator. For example, the Stochastic Oscillator will probably use it in a different manner to another trader using the same indicator or set of indicators, making technical analysis extremely subjective. Having said that, there is merit to technical trading, and as unintuitive as it may seem, previous price patterns do appear time and time again.As an increasing number of traders seek specific market points, the probability of those points holding significance also increases. Read this Term perspectives on futures Futures Futures or a futures contract represents a legal agreement to buy or sell a security or asset at a predetermined price at a specified time in the future. Of note, the parties are not known to each other.These transactions usually involve commodities or other securities involving the buying and selling for a forward or predetermined price.Futures also adhere to a delivery date, which specifies the date of delivery and payment. Relative to other forms of investing futures are much more complex, as they involve specified and non-flexible parameters.Futures Trading ExplainedFutures contracts are negotiated at exchanges that act as a unified marketplace for both buyers and sellers. Buyers of contracts represent long position holders, while selling parties constitute short position holders.Both parties risk their counterparty walking away if the price goes against them. As such, the contract can involve both parties incurring a margin of the value of the contract with a mutually trusted third party.This margin can range substantially, depending on the current volatility of the market of the security being traded.Futures can be incredibly risky and are the textbook definition of market speculation. A trader who predicts that the price of an asset will move in a certain direction can contract to buy or sell it in the future at a price.If this prediction is correct, the trader will profit. If the prediction is incorrect there will be losses. Futures trading is considered an advanced type of trading that requires prior knowledge and understanding.For this reason, retail traders will seldom be afforded access to futures trading by brokers without first undergoing specific questions or account requirements. Futures or a futures contract represents a legal agreement to buy or sell a security or asset at a predetermined price at a specified time in the future. Of note, the parties are not known to each other.These transactions usually involve commodities or other securities involving the buying and selling for a forward or predetermined price.Futures also adhere to a delivery date, which specifies the date of delivery and payment. Relative to other forms of investing futures are much more complex, as they involve specified and non-flexible parameters.Futures Trading ExplainedFutures contracts are negotiated at exchanges that act as a unified marketplace for both buyers and sellers. Buyers of contracts represent long position holders, while selling parties constitute short position holders.Both parties risk their counterparty walking away if the price goes against them. As such, the contract can involve both parties incurring a margin of the value of the contract with a mutually trusted third party.This margin can range substantially, depending on the current volatility of the market of the security being traded.Futures can be incredibly risky and are the textbook definition of market speculation. A trader who predicts that the price of an asset will move in a certain direction can contract to buy or sell it in the future at a price.If this prediction is correct, the trader will profit. If the prediction is incorrect there will be losses. Futures trading is considered an advanced type of trading that requires prior knowledge and understanding.For this reason, retail traders will seldom be afforded access to futures trading by brokers without first undergoing specific questions or account requirements. Read this Term and more.